


Pzena U.S. Large Cap vs Passive
For Financial Advisor Use Only | Updated October 2026

Over the past few years, U.S. large-cap indices have been dominated by extreme momentum stocks mostly levered to the AI theme. These types of one-way markets are particularly challenging for active managers, who are conditioned to sell outperformers and recycle capital into undervalued stocks. In fact, nearly 80%1 of active U.S. large-cap funds underperformed their respective benchmarks over the past two years. Despite U.S. indices’ abnormally high returns since the advent of the AI revolution, we believe the passive option is not an effective way to achieve true value exposure – which has historically generated above-market returns2 – within the U.S. large-cap market. Our view is based on the following three key factors: 1) index composition, 2) starting point valuation, and 3) the current anomalous market environment.
INDEX COMPOSITION
In our view, the Russell 1000 Value Index (R1000V) no longer represents a true value portfolio. It currently contains 870 stocks3, since Russell’s growth and value indices are required to have the same aggregate market cap, and its largest holding is Amazon, with a 5.95% weighting. The index also includes Microsoft, Intel, Meta (split between the value and growth indices), and richly valued non-tech stocks like Walmart, which trades at over 35x forward earnings. This dynamic is a result of the extreme concentration in the broader U.S. market, as illustrated in Exhibits 1 and 2.
Exhibit 1: Number of Holdings
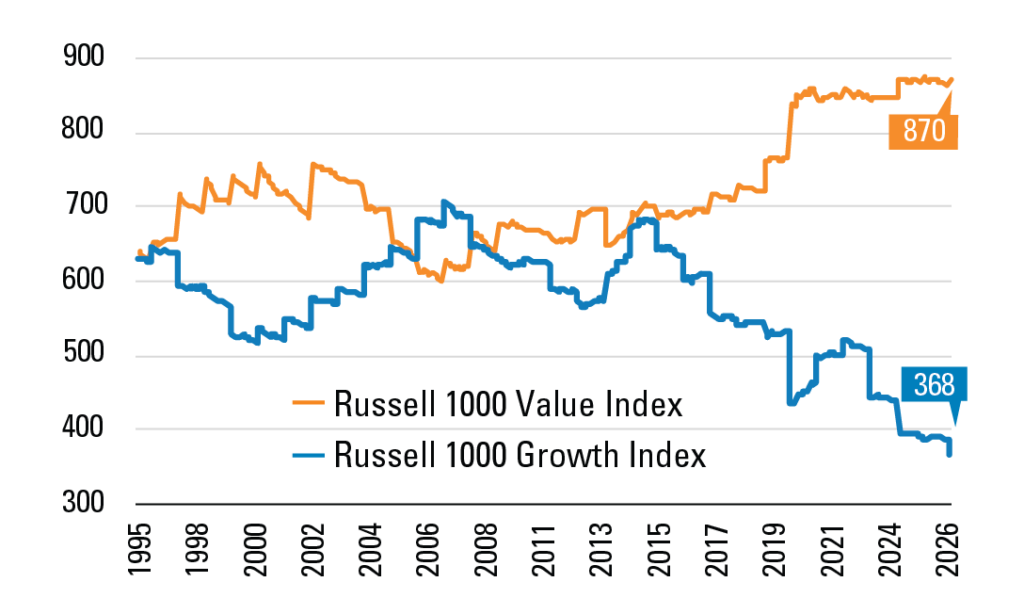
Source: FactSet, Pzena analysis
Monthly data through June 30, 2026.
Exhibit 2: Weight of Russell 1000 Growth Index’s Top 5 Companies
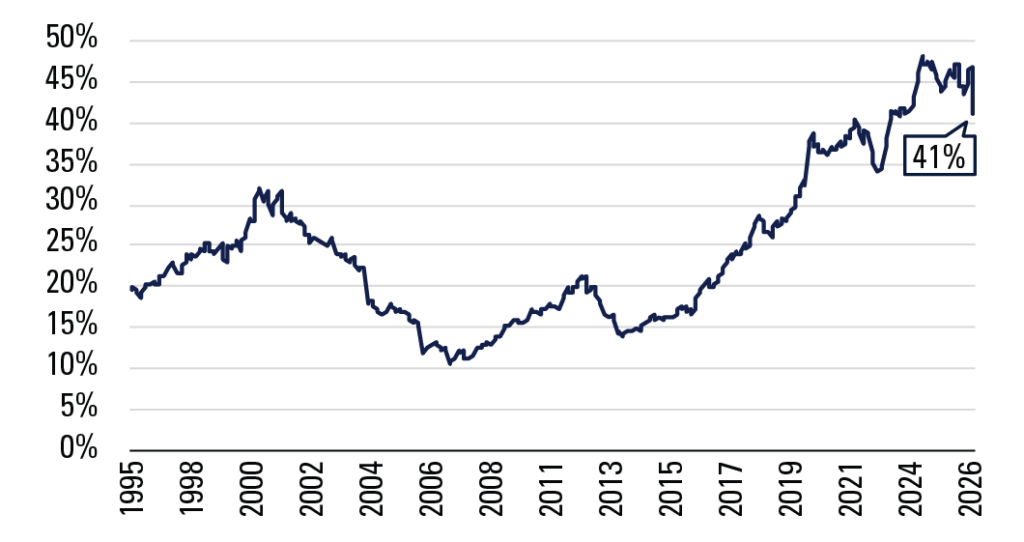
Source: FactSet, Pzena analysis
Monthly data through June 30, 2026.
STARTING POINT VALUATION
As demonstrated by the portfolio characteristics of our Large Cap Value strategy (Exhibit 3), the net result of the index composition issue is that our portfolio is much cheaper than the R1000V. In our view, this disparity in starting valuations is favorable in terms of expected forward returns.
Exhibit 3: Portfolio Characteristics: Pzena Large Cap Value
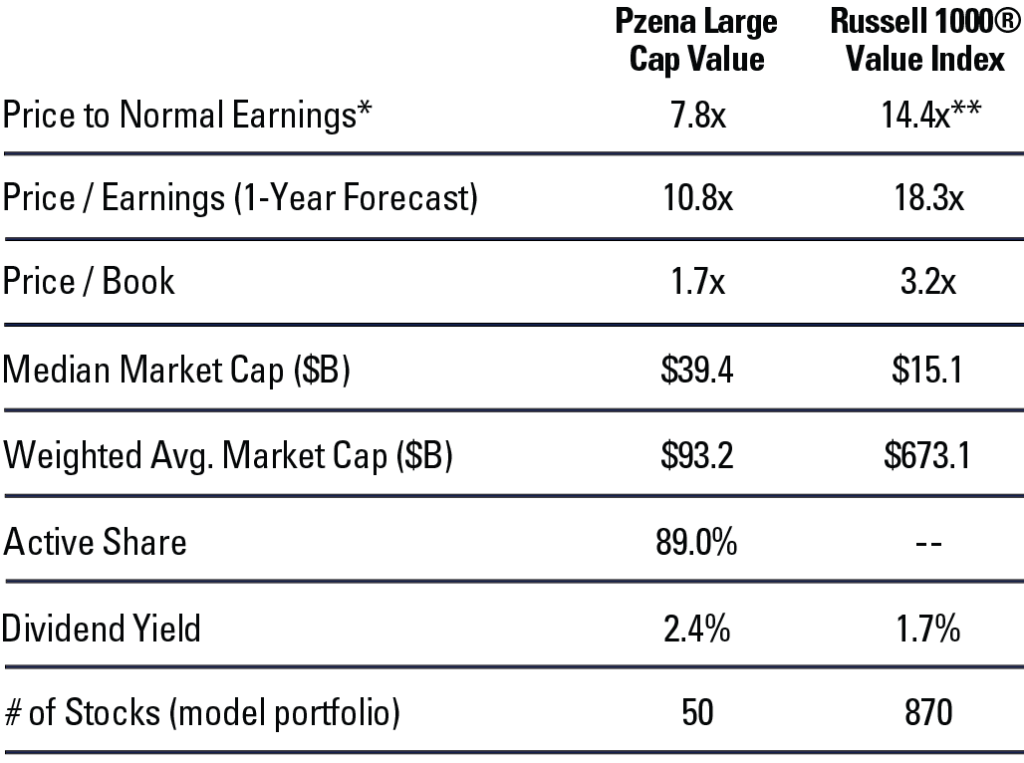
*Pzena’s estimate of normal earnings;
**Large Cap Universe Median (500 largest U.S. companies).
Source: FactSet, Russell 1000® Value Index, Pzena Analysis as of June 30, 2026.
Anomalous current market environment
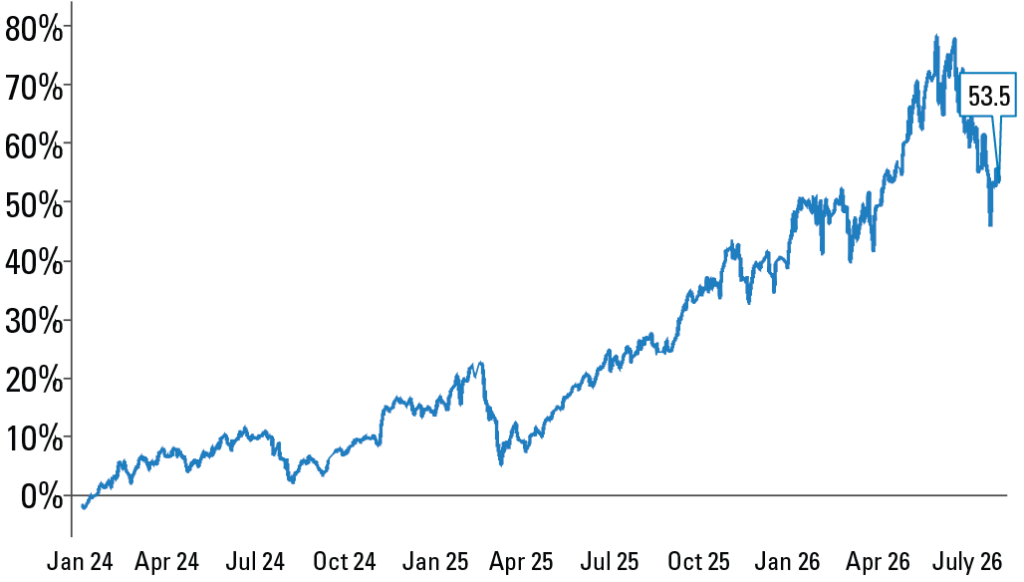
We have been operating in what we see as an anomalous market environment for much of the past two years; specifically, the momentum-driven U.S. market has been one of the most extreme in history.
Given our disciplined approach to value investing, this two-year momentum-driven period has presented challenges in terms of relative returns; however, it has also created compelling company-specific opportunities moving forward. Our investment process and philosophy focus on investing in companies that are undervalued, often due to idiosyncratic issues that have depressed their valuations. In other words, we often invest in out-of-favor companies trading at a discount, rather than chasing momentum.
Exhibit 4: U.S. Large-Cap Stocks Highest Quintile of 9 Mo. Price Momentum
Trailing-12-Month Relative Returns vs. Universe (1953 – Early August 2026)
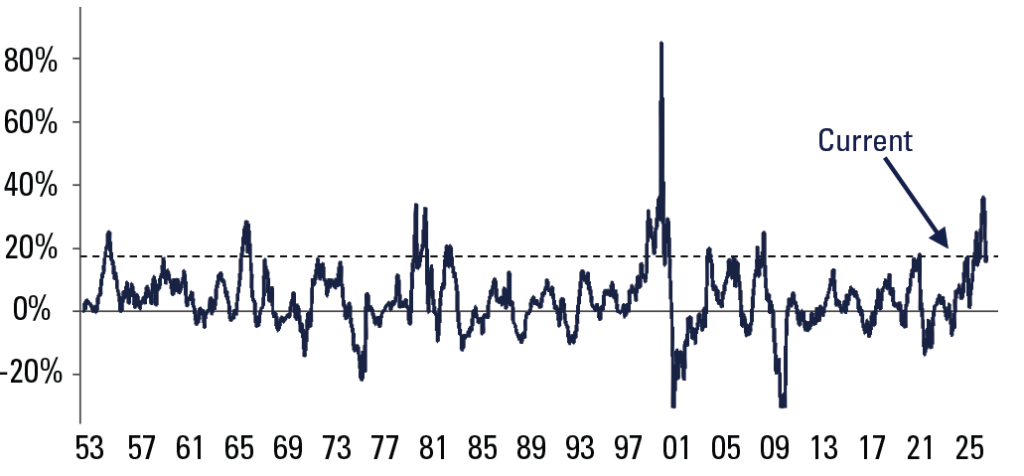
Source: Empirical Research Partners
Universe is the largest ~750 US stocks. Momentum is defined as the best quintile of the largest ~750 US stocks measured by nine-month daily price trend. All equal-weighted data from 1953-early August 2026.
Does not represent any specific Pzena product or service. Past performance does not predict future returns.
Exhibit 5: U.S. Large-Cap Stocks Highest Quintile of Nine-Month Price Momentum
Cumulative Relative Return vs. Universe 2024 – Early August 2026
Source: Empirical Research Partners
Universe is the largest ~750 US stocks. Momentum is defined as the best quintile of the largest ~750 US stocks measured by nine-month daily price trend. All equal-weighted data from January 1, 2024 – early August 2026.
Does not represent any specific Pzena product or service. Past performance does not predict future returns.
The timing of resolution of these idiosyncratic issues is uncertain. Our portfolio may experience above-average performance in certain years if concerns ease for multiple holdings, and vice versa. For example, in 2022/23, we experienced a period of strong relative performance, during which some of our larger holdings benefitted from positive resolutions to their company-specific headwinds. Since then, we have found a broad-based set of new opportunities, reflecting difficult operating environments for several companies that are now in the portfolio at what we believe to be very attractive valuations.
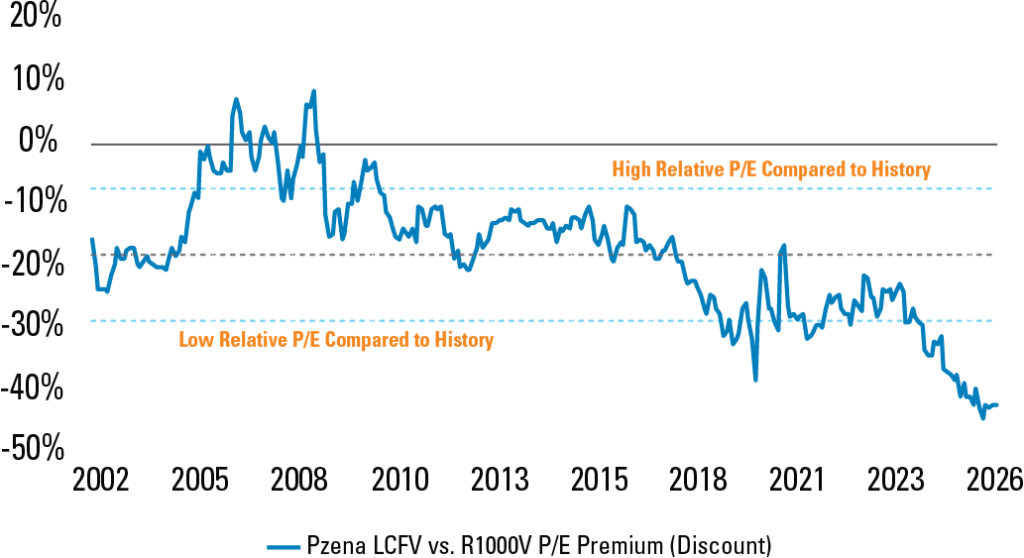
The momentum-driven nature of the market has meant that companies whose operating environments have not improved have been left behind – or worse – while stocks with positive momentum (increasingly represented in the R1000V) have enjoyed one of the biggest runs in history. The R1000V posted significantly above-average performance over the last two years (19.1% as of August 31 vs. a 12% historical average4) and now trades at an unusually high valuation premium relative to our Pzena Large Cap Focused Value portfolio.
Exhibit 6: Pzena Large Cap Focused Value vs. Russell 1000 Value Index
Relative Forward Price/Earnings Premium (Discount) 2002 – June 2026
Source: FactSet, Pzena analysis
Pzena Large Cap Focused Value Composite estimate data.
FY1 data per FactSet from December 31, 2002 – June 30, 2026.
The R1000V is clearly more expensive than our U.S. largecap portfolios, and its composition does not currently reflect a reasonable value option, in our view. In recent years, the market has largely been driven by a singular theme, and momentum has taken over, which is not a conducive environment for our strategy on a relative basis.
We believe the fundamentals and valuations of our portfolio companies are very attractive when viewed over the long term. Notably, the valuation gap between our portfolio and the index (see Exhibit 6) is among the widest in history – a function of both our Large Cap Focused Value strategy being cheaper than average (19th percentile on a forward price-to-earnings basis) and the R1000V being far more expensive than average (95th percentile)5. We maintain that a targeted, research-driven, active strategy is crucial to generating alpha, and we believe that our U.S. large-cap portfolios are especially well positioned to achieve long-term returns in excess of the R1000V benchmark.
Footnotes:
1. Source: eVestment, Pzena analysis; as of June 30, 2026
2. Source: Kenneth R. French data
3. As of June 30, 2026
4. Source: Russell® 1000 Value Index, annualized
5. Source: FactSet, Pzena analysis; Dec. 2002 – Jun. 2026
Pzena Large Cap Value Strategy
Performance Summary (USD)

Pzena Large Cap Value
Calendar Year Returns (USD)

Pzena Large Cap Focused Value Strategy
Performance Summary (USD)

Pzena Large Cap Focused Value Strategy
Calendar Year Returns (USD)

Past performance does not predict future returns. Returns could be impacted, positively or negatively, by currency fluctuations, where applicable.
See Disclosures Section.
Gross rates of return are presented gross of investment management fees and net of the deduction of transaction costs. An investor’s actual return will be reduced by investment management fees. Net Returns are derived using a model fee applied monthly to Gross returns. Pzena uses the highest tier fee schedule, excluding performance fees, to illustrate the impact of fees on performance returns. As product fees change, the current highest tier schedule will be in effect.
Composite returns are benchmarked to the Russell 1000® Value Index (the “Index”). The benchmark is used for comparative purposes only. The Russell 1000® Value Index measures the performance of the large-cap value segment of the US equity universe. It includes those Russell 1000® companies with lower price-to-book ratios and lower expected growth values. The Index cannot be invested in directly. The performance of the Index reflects the reinvestment of dividends. The Pzena Large Cap Value strategy is significantly more concentrated in its holdings and has different sector weights than the Index. Accordingly, the performance of the Composite will be different from, and at times more volatile, than that of the Index.



Further Information
This document is intended solely for informational purposes. The views expressed reflect the current views of Pzena Investment Management (“PIM”) as of the date hereof and are subject to change. PIM is a registered investment adviser registered with the United States Securities and Exchange Commission. PIM does not undertake to advise you of any changes in the views expressed herein. There is no guarantee that any projection, forecast, or opinion in this material will be realized. Past performance does not predict future returns.
All investments involve risk, including loss of principal. Investments may be in a variety of currencies and therefore changes in rates of exchange between currencies may cause the value of investments to decrease or increase. The price of equity securities may rise or fall because of economic or political changes or changes in a company’s financial condition, sometimes rapidly or unpredictably. Investments in foreign securities involve political, economic and currency risks, greater volatility and differences in accounting methods. These risks are greater for investments in Emerging Markets. PIM’s strategies emphasize a “value” style of investing, which targets undervalued companies with characteristics for improved valuations. This style of investing is subject to the risk that the valuations never improve or that returns on “value” securities may not move in tandem with the returns on other styles of investing or the stock market in general.
This document does not constitute a current or past recommendation, an offer, or solicitation of an offer to purchase any securities or provide investment advisory services and should not be construed as such. The information contained herein is general in nature and does not constitute legal, tax, or investment advice. PIM does not make any warranty, express or implied, as to the information’s accuracy or completeness. Prospective investors are encouraged to consult their own professional advisers as to the implications of making an investment in any securities or investment advisory services.
The MSCI information may only be used for your internal use, may not be reproduced or redisseminated in any form and may not be used as a basis for or a component of any financial instruments or products or indices. None of the MSCI information is intended to constitute investment advice or a recommendation to make (or refrain from making) any kind of investment decision and may not be relied on as such. Historical data and analysis should not be taken as an indication or guarantee of any future performance analysis, forecast or prediction. The MSCI information is provided on an “as is” basis and the user of this information assumes the entire risk of any use made of this information. MSCI, each of its affiliates and each other person involved in or related to compiling, computing or creating any MSCI information (collectively, the MSCI Parties) expressly disclaims all warranties (including, without limitation, any warranties of originality, accuracy, completeness, timeliness, non-infringement, merchantability and fitness for a particular purpose) with respect to this information. Without limiting any of the fore-going, in no event shall any MSCI party have any liability for any direct, indirect, special, incidental, punitive, consequential (including, without limitation, lost profits) or any other damages.
© Pzena Investment Management, LLC, 2026. All rights reserved.