


Extreme Valuations & Durable Fundamentals: The Case for Small Caps Globally
8 min read

Third Quarter 2025 Commentary
The Magnificent Seven have driven outsized returns, leaving global equity markets increasingly concentrated. By contrast, small caps have lagged meaningfully and now trade near historic relative lows, setting up what we see as an attractive entry point for long-term investors. In this note, we will cover:
-
Performance & History: How small caps have trailed large caps, and what past cycles of large-cap dominance suggest
-
Fundamentals vs. Sentiment: Why earnings trends favor small caps, yet multiples have driven the gap
-
Risks & Market Structure: Addressing leverage, unprofitable companies, index construction, and the role of private equity
-
Looking Ahead: Why today’s extreme valuation spread offers the potential for multi-year small-cap outperformance
THE SMALL-CAP VALUATION GAP
With global stock market performance dominated by the so-called Magnificent Seven over the past several years, we believe small-cap stocks worldwide are at an attractive entry point relative to large caps. Despite rising more than 140% since the depths of the COVID-19 pandemic, global small caps trade at near record lows relative to global large-cap stocks (Exhibit 1).
Exhibit 1: Small Caps Near Record Low Valuation versus Large Caps
Small Cap & Large Cap Relative P/E Ratios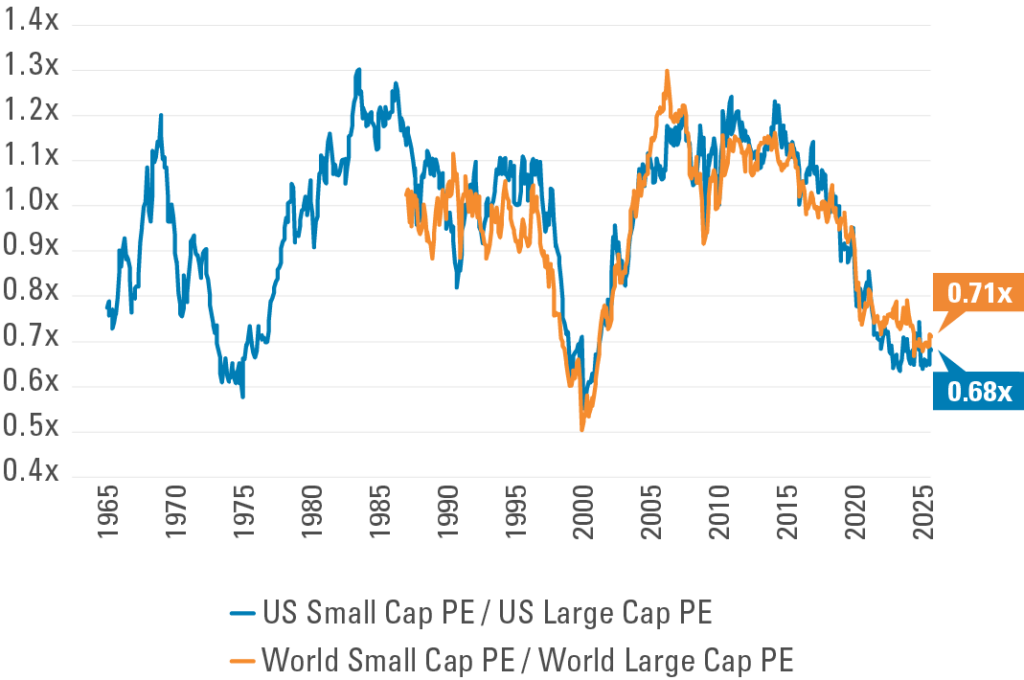
Source: Empirical Research Partners, Pzena analysis
US Large Cap = Largest 1000 US stock universe. US Small Cap = Next 2000 largest stock universe.
World Large Cap = MSCI World universe. World Small Cap = MSCI World Small Cap universe.
Trailing price/earnings data from January 31, 1965 – September 30, 2025.
As the Magnificent Seven have outperformed, U.S. and global equity markets have become more concentrated. Small caps have experienced the other side of that trend and now represent only 1.2% of total U.S. market capitalization, close to a 100-year low and well below the historical average of 3.6% (Exhibit 2).
Exhibit 2: Small Cap Now Makes Up Less Than 1.5% of U.S. Equity Markets
Small Cap Stocks as % of Total U.S. Market Cap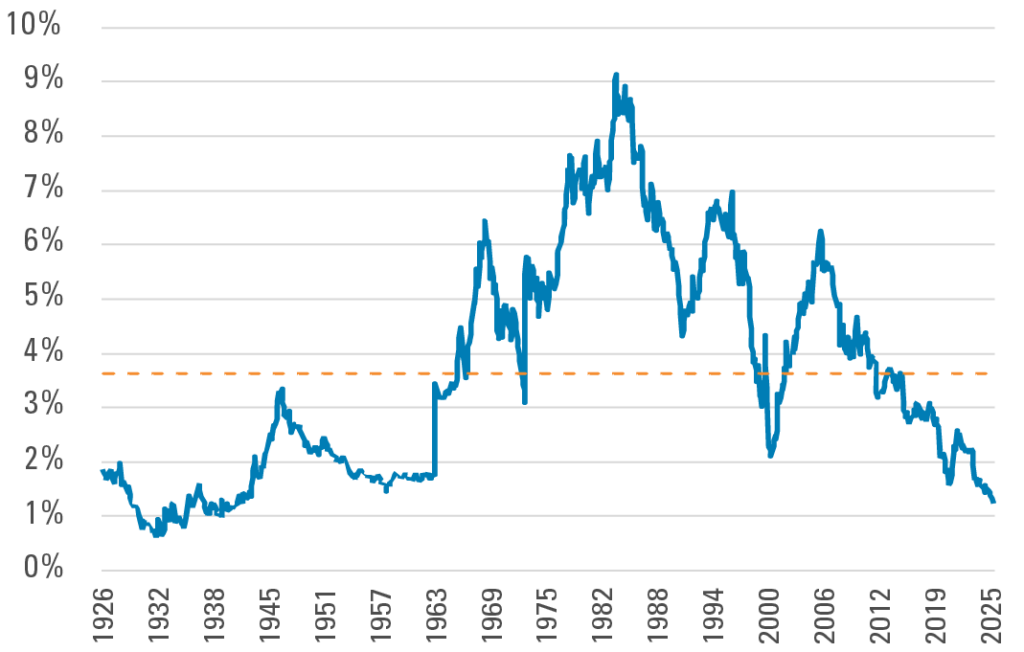
Source: Kenneth R. French, Pzena analysis Universe is all NYSE, AMEX, and NASDAQ stocks defined by Kenneth R. French data library. Small cap is the bottom 30% of names based on NYSE breakpoints. Monthly data from July 31, 1926 – August 31, 2025.
HOW DID WE GET HERE?
The initial recovery after the Global Financial Crisis was marked by slow growth and very low financing costs. This environment supported venture capital and public growth investing. Even so, small caps held their ground, helped by the domestic recovery and the reflation trade that followed the 2016 election.
The U.S. economy expanded further into 2017 and 2018, but uncertainty over trade wars, rising interest rates, and recession risk pushed investors toward perceived safe havens. Expensive growth companies that promised steady earnings gained favor, and from there, the valuation gap widened. After their historic decline in 2022, mega-cap growth stocks quickly regained leadership on enthusiasm for artificial intelligence, while higher-for-longer rates favored the largest companies with significant cash balances and mostly fixed-rate debt.
A DECADE OF DIVERGENCE
Over the past decade, global small caps delivered a decent annual return of 9.6%, compared with 12.4% for global large caps. The biggest driver of this gap was the United States: U.S. large caps returned 15.0% per year, while U.S. small caps returned only 9.8%1.
The disparity is significant but not unprecedented. Rolling 10-year periods of large-cap dominance similar or greater than the recent period have occurred 42 times between 1926 and 2025 (Exhibit 3). The current stretch ranks among the more severe, but history suggests such cycles are part of long-term market patterns rather than permanent shifts. The picture of global small caps is similar, with the most recent rolling 10-year relative return in the tenth percentile of relative returns versus large-cap returns.
Exhibit 3: Frequency of Rolling 10-Year Relative Returns Since 1926
U.S. Small Cap Has Underperformed Large Cap by 600bps the Past 10 Years
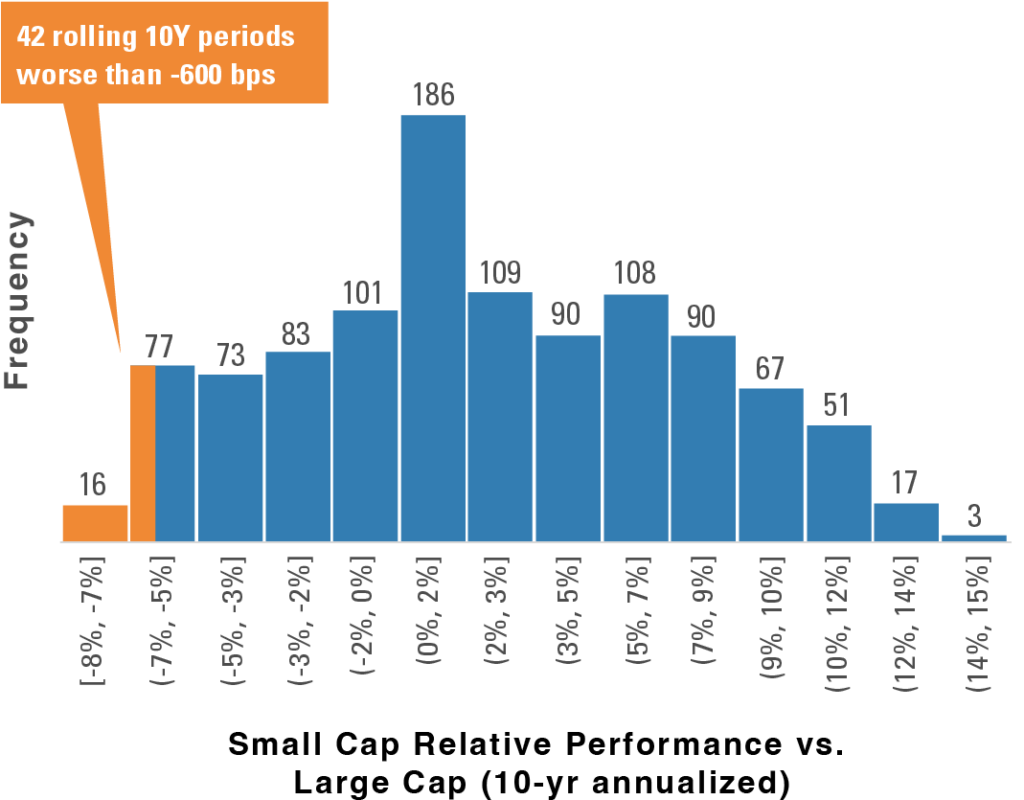
Source: Kenneth R. French, Pzena analysis Universe is all NYSE, AMEX, and NASDAQ stocks defined by Kenneth R. French data library. Cap-weighted monthly data, July 31, 1926 – August 31, 2025. Small cap = smallest 30% of companies based on NYSE breakpoints, Large cap = largest 30%. Does not represent any specific Pzena product or service. Past performance is not indicative of future returns.
IS THE PERFORMANCE DISPARITY JUSTIFIED?
If stronger fundamentals explained the outperformance of large caps, the disparity might be easier to accept. But fundamentals tell a different story. Small caps generated significantly higher combined free cash flow growth and dividends (fundamental return)—in excess of 500 basis points per year more than large caps. The difference in returns has been driven entirely by sentiment and relative multiple expansion (Exhibit 4).
Exhibit 4: Global Small Cap Last 10 Years: Superior Free Cash Flow Growth
Small vs. Large Performance Drivers Based on FCF Last 10 Years Through Sep 2025
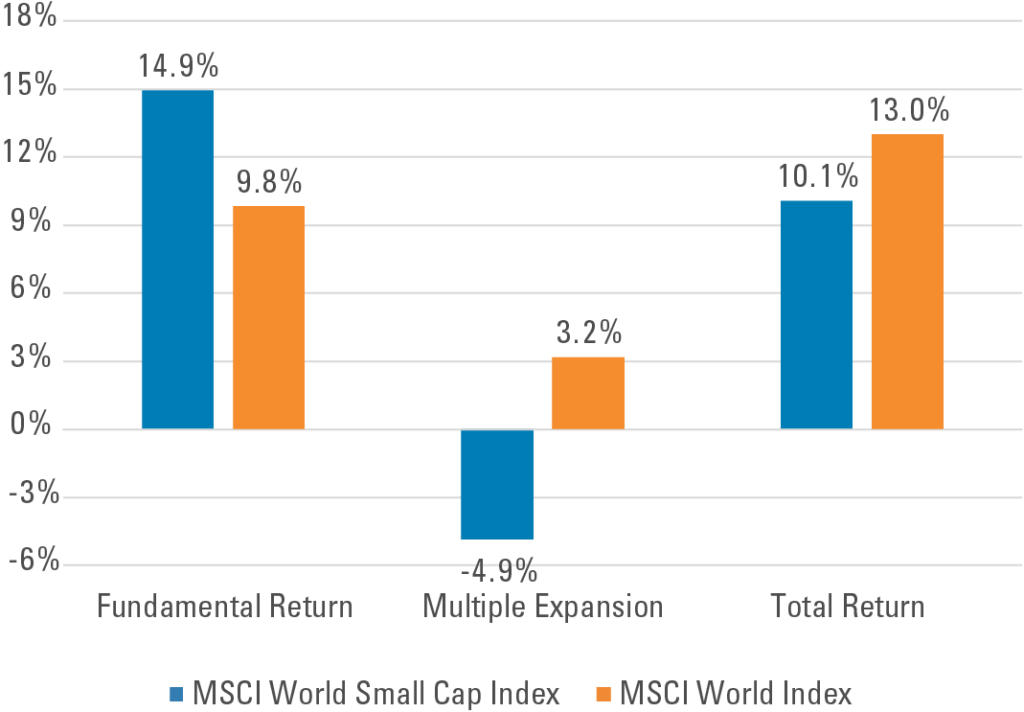
Source: FactSet, Pzena analysis Fundamental Return = dividend return + free cash flow growth. Analysis uses LTM free cash flow data. Free cash flow was chosen instead of the more commonly used GAAP EPS because write-downs and unusual expenses for small cap stocks are commonplace. All data annualized in US dollars as of September 30, 2025. Past performance is not indicative of future returns.
Looking ahead, consensus forecasts show small caps continuing to outpace large caps over the next three years, and beating the Magnificent Seven in 2026 and 2027 (Exhibit 5).
Exhibit 5: Earnings Convergence
Mag 7 Earnings Growth Is Moderating
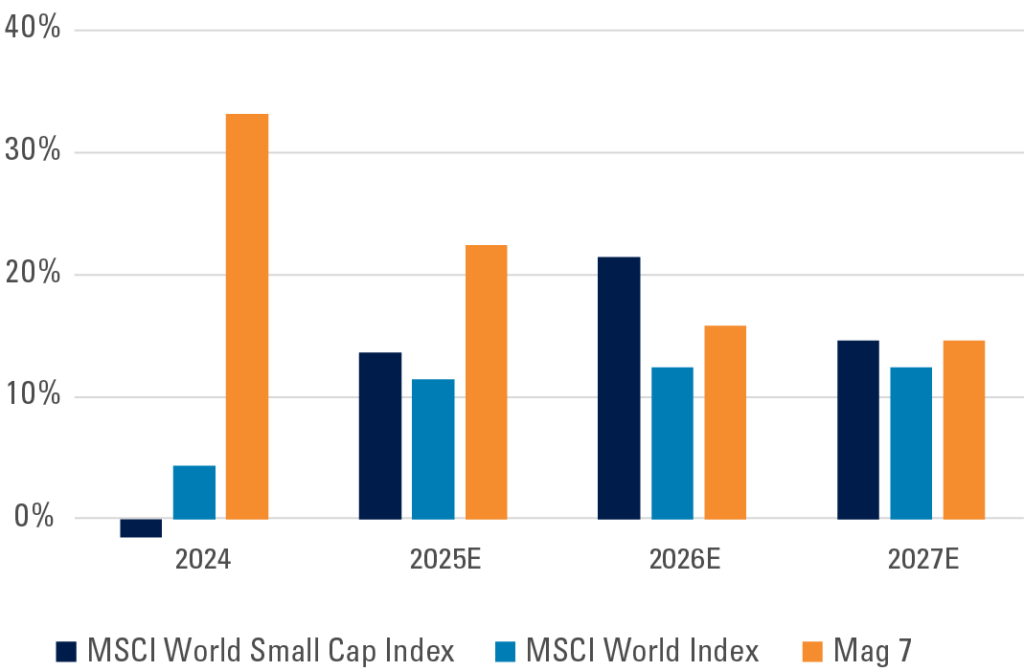
Source: FactSet, Pzena Analysis Year-over-year earnings growth. Mag 7 = Apple, NVIDIA, Microsoft, Amazon.com, Meta Platforms, Tesla, and Alphabet. Earnings data per FactSet as of September 30, 2025
RISKS AND ACTIVE MANAGEMENT
Two issues are often raised to explain small-cap underperformance: leverage and unprofitable companies. While smaller companies do carry more debt, the exposure is highly concentrated. Excluding financials, which naturally employ leverage, just 77 companies account for more than half of the Russell 2000 Index’s $935 billion in net debt2. These firms represent only 8.2% of the index’s non-financial market capitalization.
Profitability shows a similar pattern. More than 40% of the Russell 2000 Index is unprofitable, compared with just over 10% of the Russell 10003. Both issues can be managed; active investors can avoid the weakest balance sheets and the persistently loss-making companies, while selectively investing in those with attractive risk–reward potential.
THE PRIVATE EQUITY EFFECT
Another explanation often cited for small-cap underperformance is the role of private equity. Over the past 30 years, the number of listed U.S. companies has fallen by 40-50%, as firms stay private longer and as public companies are taken private at elevated rates. This trend has reduced the universe of publicly traded small-cap stocks.
However, the impact is often overstated. Most of the decline has taken place in the micro-cap space, which sits below the traditional small-cap range. Since 1980, the number of small-cap stocks in the smallest cohort has fallen by 13%4, while the number of micro-cap stocks has fallen by 52%. In addition, private equity can serve as a stabilizing force, stepping in as a buyer during periods of small-cap weakness. In our own 30-year history, which coincides with the reduction in public listings, small-cap investing has delivered some of our strongest long-term alpha.
See our writeup on The Small Cap Value Opportunity for more details on this topic.
WHERE TO FROM HERE?
The past decade has seen sustained multiple compression for small caps relative to large caps. We believe this trend sets up an attractive starting point for future outperformance. Timing a turn in the cycle is never certain, but history shows that extreme valuation gaps (like today’s) have often been followed by multi-year periods of small-cap leadership (Exhibit 6).
It is also worth noting that the last two periods of similar dislocation were marked by powerful investment themes: the Nifty Fifty and the Dot-Com era. Both included companies that went on to be highly successful, but in each case, valuations rose far beyond what fundamentals could justify. The result was a long stretch of strong small-cap performance once the cycle turned.
Exhibit 6: Global Small Cap vs. Large Cap Relative Valuation & Forward Returns
Relative Trailing P/E of Global Small Cap vs. Global Large Cap &
Subsequent 5YR Annualized Relative Returns (1987 – Sep 2025)
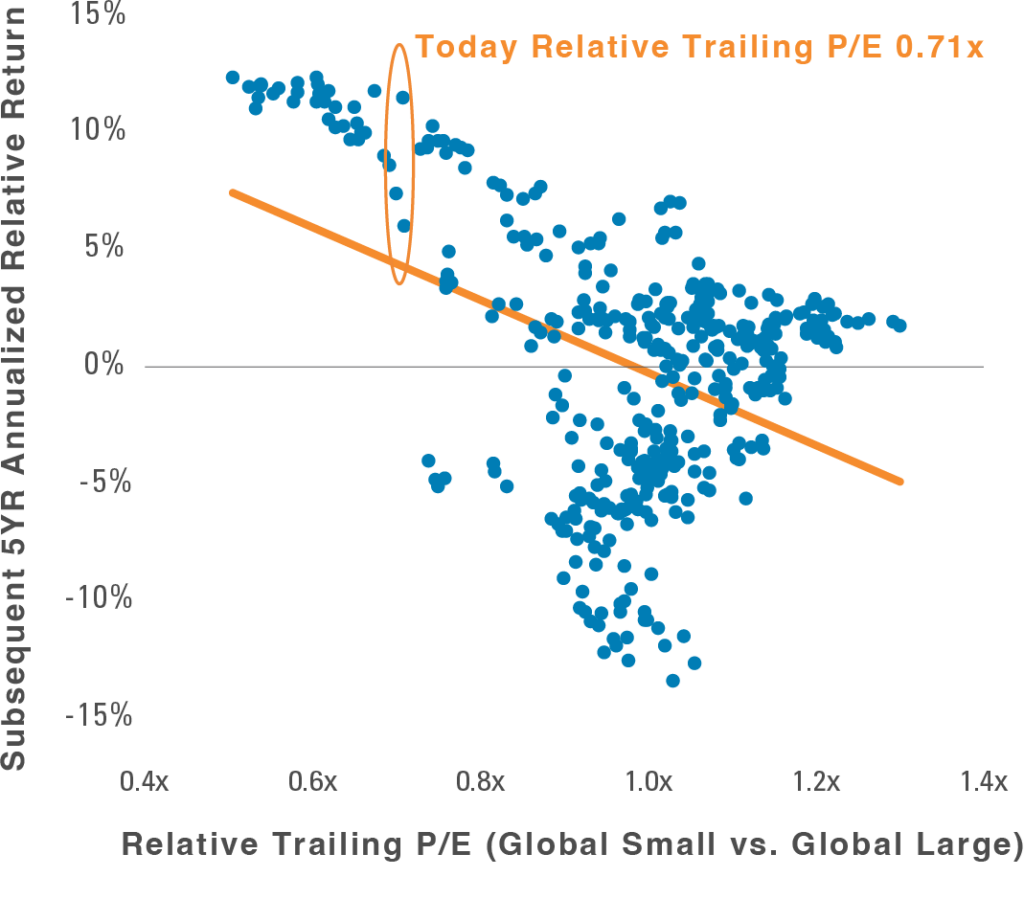
Source: Empirical Research Partners, Pzena analysis Global Large Cap = MSCI World universe. Global Small Cap = MSCI World Small Cap universe. Trailing price/earnings and US dollar total return data from January 31, 1987 – September 30, 2025. Does not represent any specific Pzena product or service. Past performance is not indicative of future returns.
CONCLUSION
Small caps have endured a decade in which they were overshadowed by mega-cap growth stocks and weighed down by sentiment, higher rates, and structural shifts in capital markets. Yet fundamentals remain intact. Earnings growth has matched or exceeded that of large caps, valuations are near historic lows, and history shows that periods of extreme underperformance have often marked the beginning of strong multi-year recoveries.
While risks around leverage, profitability, and private equity flows are real, they can be addressed through prudent active management. With global small caps trading at one of the most attractive entry points in decades, we believe investors are well positioned to benefit from the next phase of the cycle.
_____________
Footnotes
1. Source: MSCI and FTSE Russell
2. FactSet, Pzena analysis
3. FactSet, Pzena analysis
4. Kenneth R. French, Pzena analysis
The Case for Small Caps Globally
Small caps globally trade at steep discounts compared to large caps, levels last seen in the Nifty-Fifty and dot-com eras. This podcast episode explores the context behind this valuation gap and what it could mean for active investors focused on fundamentals.


FURTHER INFORMATION
These materials are intended solely for informational purposes. The views expressed reflect the current views of Pzena Investment Management (“PIM”) as of the date hereof and are subject to change. PIM is a registered investment adviser registered with the United States Securities and Exchange Commission. PIM does not undertake to advise you of any changes in the views expressed herein. There is no guarantee that any projection, forecast, or opinion in this material will be realized. Past performance is not indicative of future results.
All investments involve risk, including loss of principal. Investments may be in a variety of currencies and therefore changes in rates of exchange between currencies may cause the value of investments to decrease or increase. The price of equity securities may rise or fall because of economic or political changes or changes in a company’s financial condition, sometimes rapidly or unpredictably. Investments in foreign securities involve political, economic and currency risks, greater volatility and differences in accounting methods. These risks are greater for investments in Emerging Markets. Investments in small-cap or mid-cap companies involve additional risks such as limited liquidity and greater volatility than larger companies. PIM’s strategies emphasize a “value” style of investing, which targets undervalued companies with characteristics for improved valuations. This style of investing is subject to the risk that the valuations never improve or that returns on “value” securities may not move in tandem with the returns on other styles of investing or the stock market in general.
This document does not constitute a current or past recommendation, an offer, or solicitation of an offer to purchase any securities or provide investment advisory services and should not be construed as such. The information contained herein is general in nature and does not constitute legal, tax, or investment advice. PIM does not make any warranty, express or implied, as to the information’s accuracy or completeness. Prospective investors are encouraged to consult their own professional advisers as to the implications of making an investment in any securities or investment advisory services.
© Pzena Investment Management, LLC, 2025. All rights reserved.