


Re-Rating, De-Rating, and What Really Matters
12 min read

Second Quarter 2026 Commentary
Global equity markets have delivered strong returns this year, but a single force is behind the vast majority of those gains. An extraordinary earnings boom in semiconductor stocks, fueled by AI capital spending, has powered returns in both emerging markets and developed market value indices. Understanding what is driving those earnings, and whether they are sustainable, is where our investment process begins.
In this essay, we discuss these factors:
- Why the semiconductor earnings boom has driven concentrated performance across global equity markets, from the MSCI Emerging Markets (EM) Index to the Russell 1000 Value Index
- How our normalized earnings framework leads us to evaluate businesses, and why today’s memory margins do not represent a new normal
- Why we owned memory semiconductors in our emerging markets portfolios when they were cheap and trimmed them as their prices rose
- Why our portfolio is an expression of our process, designed to protect against bubbles and find value in stocks left behind
A SEMICONDUCTOR EARNINGS BOOM
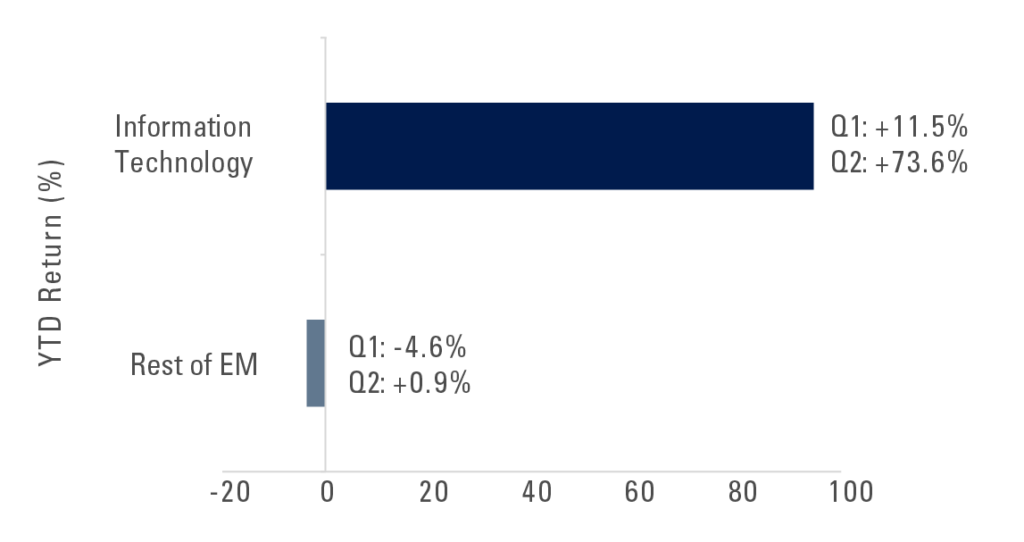
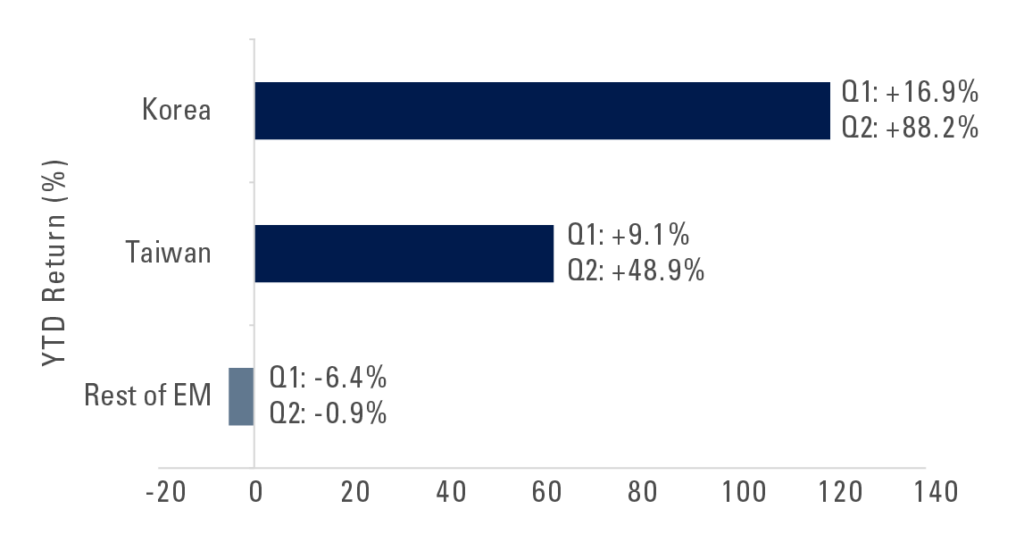
While emerging markets were up an impressive 24% in the first half of the year, strip away the semiconductor sector and the picture changes entirely. Information Technology, overwhelmingly memory and logic chip companies domiciled in Korea and Taiwan, has accounted for roughly 103% of the MSCI EM Index’s total return this year (Exhibit 1). Korea and Taiwan together contributed more than 113% of EM’s gains, meaning the rest of the emerging world was flat to negative in aggregate (Exhibit 2). This is not a broad market rally. It is an earnings boom in a single industry, concentrated in two countries, reflected in index weights that have grown to historically unusual levels.
Exhibit 1: HMSCI EM YTD Return by Sector Through June 2026
IT Sector = 103% of Total EM Return (+24%)
Source: FactSet, Pzena analysis
Data in US dollars December 31, 2025 – June 30, 2026.
Past performance does not predict future returns.
This is not a phenomenon unique to emerging markets. In the United States, close to half of the Russell 1000 Value Index’s year-to-date return has been driven by semiconductors. The common thread between EM and the US is an AI-driven surge in semiconductor earnings that is large enough to dominate returns wherever semis represent a meaningful share of the index.
Exhibit 2: MSCI EM YTD June 2026
Korea + Taiwan = 113% of Total Return (Total EM Return: +24%)
Source: FactSet, Pzena analysis
Data in US dollars December 31, 2025 – June 30, 2026.
For active managers committed to normalized valuation, this environment has been difficult. When a single earnings story dominates across markets and geographies at the same time, there is a meaningful cost of not participating in a dramatic runup in chip stocks. It is precisely in moments like these, that the discipline of a long-term valuation framework matters most.
HOW WE THINK ABOUT CYCLICAL BUSINESSES
Our valuation process is anchored to one question: what is this business capable of earning on a normalized, mid-cycle basis, and what are we paying for that? We define normal earnings not as last quarter’s results or next year’s consensus estimate, but as what we believe the business can sustain on average across a full cycle, accounting for industry structure, competitive position, and the behavior of the underlying economics.
For commodity businesses—and memory semiconductors are commodity businesses—this framework produces a very different answer than current earnings suggest. Commodity industries are characterized by supply responses to elevated pricing, demand destruction when prices rise too far, and a persistent tendency for margins to revert toward levels consistent with the cost of capital. The historical record offers little support for the idea that this time is different.
The test we apply is this: if you had to own this business at today’s price as a long-term holding, not trade it, not time the cycle, but commit to it at the current valuation, would you? For a commodity business whose current margins are historically unprecedented, the answer is no. This is not a forecast about when the cycle will turn; it is a statement about the risk-reward of buying stocks while earnings are peaking in a business whose history is a series of peaks and troughs. We will miss stock price momentum while the peak goes higher, but it avoids the risk of playing the momentum game. We believe that is the correct result of our process.
THE MEMORY MARGIN MATH
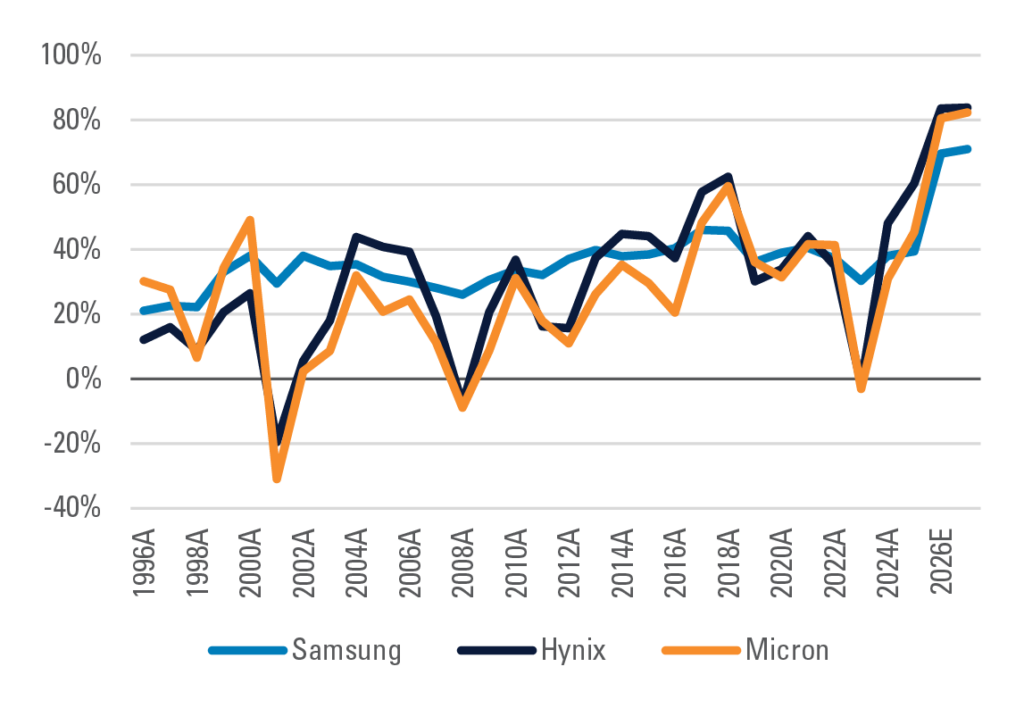
The current memory earnings boom shows why current earnings can be a poor guide to value. Gross margins are at unprecedented levels, reaching north of 80% for SK Hynix and Micron, which is well above the industry’s raw historical average of around 30% (Exhibit 3). Our normalized margin assumption of approximately 40% already gives the industry credit for structural improvements, including the growing share of higher-value High Bandwidth Memory (HBM)—a better business—in the product mix and the consolidation of the industry to three dominant Western producers. Even against that more generous baseline, current margins are roughly double what we believe is sustainable. DRAM fabrication costs are largely fixed in the short run, so when prices rise, nearly all of the incremental revenue flows to gross profit. When prices triple, gross profit increases sixfold and margins double.
Exhibit 3: Samsung/Hynix/Micron Gross Margins
Source: Company reports, Capital IQ estimates, Pzena analysis
Estimates as of June 30, 2026.
Memory manufacturers today report higher gross margins than NVIDIA and higher than TSMC. We do not dispute that memory is a structurally better business than it was a decade ago. Industry consolidation and the emergence of HBM as a higher-value product are real improvements. But when commodity memory companies out-earn businesses with far more durable competitive positions, it is reasonable to ask how much of today’s profitability reflects structure and how much reflects a pricing environment with no precedent in the industry’s history.
It is noteworthy that chip demand grows nicely over time, but it is the improved economics of lower chip price that explains the long term unit demand growth. The price per bit declines over time driving more demand. This continuous price decline is known as Moore’s Law. Today, the earnings growth is being driven primarily by rising memory chip prices. In that sense, it is no different than a spike in oil prices driving up oil stocks.
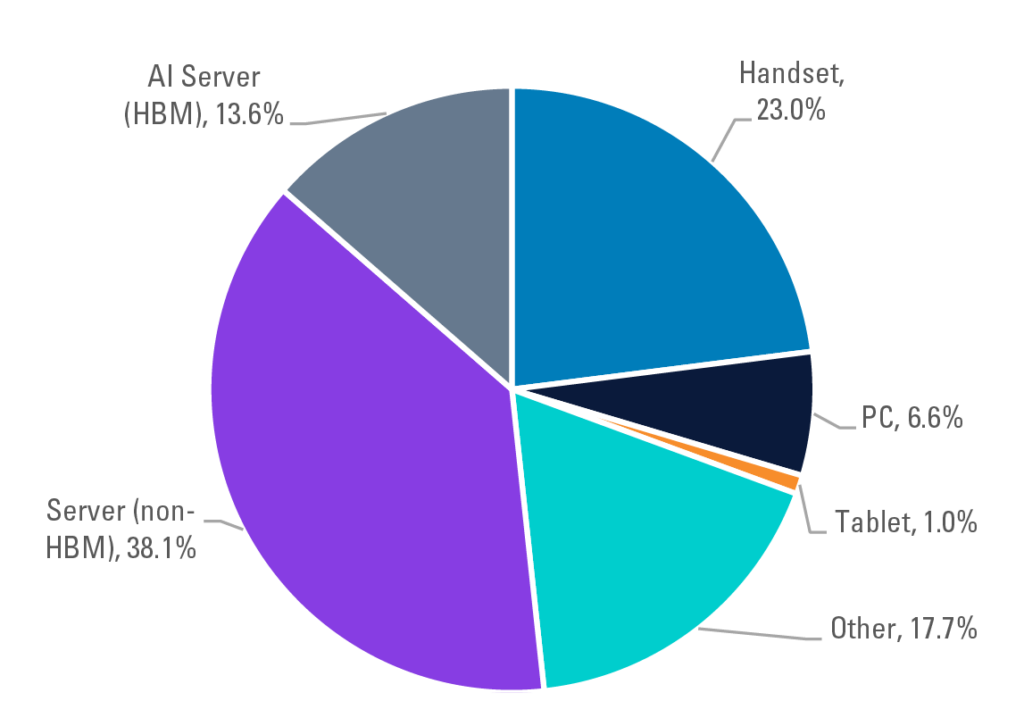
High Bandwidth Memory (HBM) accounts for only about 14% of DRAM bit demand, and much of its volume is sold under long-term agreements at pre-boom prices. This is the part that is widely misunderstood: the margin boom is not because HBM commands premium pricing. It is because commodity DRAM prices have surged, and at today’s prices, commodity DRAM is actually generating higher margins than HBM. The reason commodity DRAM is in shortage is that HBM production has absorbed significant manufacturing capacity, tightening supply across the board. More than 50% of DRAM demand comes from price-sensitive end markets: including smartphones and PCs (Exhibit 4). The current supply-demand imbalance is the product of specific conditions, not a permanent state of affairs, and the earnings power of these businesses over a full cycle will likely look very different from what it looks like today. Going from 80% gross margins back toward 40% does not cut profits in half. Because prices tripled to produce that margin expansion, the reversal reduces profits by more than 80% (Exhibit 5).
Exhibit 4: 2026E DRAM Demand by End-Market (Bit Share)
Source: Sanford C. Bernstein & Co., UBS, Pzena analysis
The bull case has grown more specific recently. Major memory producers have announced multi-year supply agreements with datacenter customers, some structured with upfront deposits. This has led bulls to argue that the earnings stream is more durable than prior cycles and that customers are unlikely to walk away given the financial commitment. We take these developments seriously. Long-term agreements represent a meaningful change in how memory is sold, and genuine price-inelastic demand from hyperscalers investing at scale in AI infrastructure is real.
That said, these contracts cover only a minority of total volume, leaving the majority of revenue still priced on a spot basis. The floor prices embedded in the agreements remain well above prior-cycle troughs, meaning customers retain meaningful incentive to walk away in a severe downturn. Even if they do honor the contracts through a downturn, the effect may simply be to pull demand forward, leaving a softer demand environment once the agreements expire. Long-term agreements change the shape of the cycle; we are not convinced they eliminate it.
Exhibit 5: Illustrative Memory P&L*
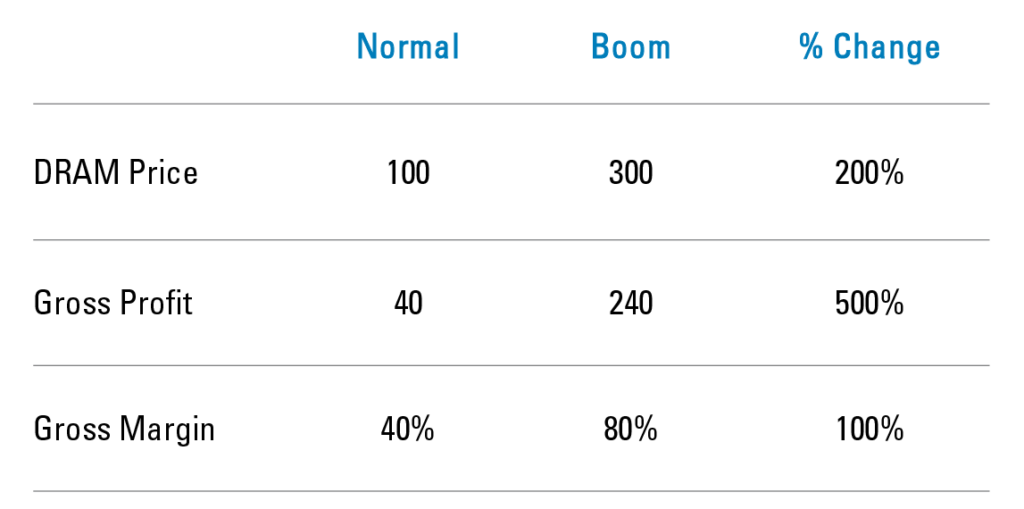
Source: Company reports, Capital IQ estimates, Pzena analysis Estimates as of June 30, 2026.
*For illustrative purposes only. Values are hypothetical and not drawn from any specific company’s financial statements or forecast. The “Normal” scenario assumes a base gross margin of 40%, consistent with the approximate normalized margin range observed across major DRAM manufacturers (Samsung, SK Hynix, Micron) over the prior decade, as reported in company filings and compiled by Capital IQ. The “Boom” scenario applies a hypothetical DRAM price increase to illustrate the operating leverage inherent in memory manufacturing: because a large portion of production costs is fixed, a given percentage increase in price flows through disproportionately to gross profit and margin — a dynamic that cuts in both directions. This example is intended to demonstrate that leverage dynamic and does not represent a price forecast, a specific company’s results, or an expectation for any particular cycle.
WHAT WE OWNED, AND WHY WE SOLD
During the downturn of 2022 and 2023, memory and semiconductor stocks fell into the cheapest quintile of our investable universe. We bought Samsung, TSMC, and several other semiconductor-related businesses when they were genuinely cheap on their mid-cycle earnings potential, and we benefited as they recovered. We bought when they were cheap and sold when they were not.
We continue to own select businesses where the earnings uplift has been driven more by unit growth and a higher-quality, less commodity-dependent product mix than by the pricing spike itself. To own the more commodity-exposed companies at current prices, one has to believe in an extended period of boom earnings. That may prove correct for a time, but valuations offer little downside support should the boom end, and we do not believe the cyclical nature of the underlying business has changed.
OUR PORTFOLIO AS AN EXPRESSION OF THE PROCESS
The same discipline that led us to buy semiconductors in 2022 and trim them on strength is at work across the rest of the portfolio today. We are finding businesses that generate strong cash flows, are genuinely cheap relative to normalized earnings, and do not require historically anomalous conditions to justify their valuations.
Over the past six months, the equal-weighted MSCI EM Index has underperformed the cap-weighted index by nearly 18%, marking the widest gap in the 34-year history of the data. This dispersion reflects how thoroughly index performance has been driven by a handful of companies rather than broad fundamental improvement. It also reflects the opportunity being created elsewhere. In emerging markets, we are finding compelling value in consumer businesses, both discretionary and staples, where valuations have compressed as capital has rotated toward the AI trade, and where the underlying fundamentals remain intact. In developed markets, we are carrying our highest-ever allocation to health care, a sector where we have historically struggled to find businesses at the right price, but where we are now finding quality, stable franchises at valuations we find attractive. These are not thematic bets. They are the output of the same normalized earnings process applied consistently, finding value in the places concentration has left behind. Periods of extreme concentration have historically resolved in favor of valuation discipline, and we believe the portfolio is positioned accordingly.
CONCLUSION
The AI earnings boom has concentrated equity market returns in historically unusual ways, and that concentration is visible across global benchmarks. Our process led us to acquire memory semiconductors when they were cheap and trim them well before the cycle peaked. Because our sell discipline takes us out of positions as they move beyond normal earnings power, we are unlikely to capture the full run-up of a commodity cycle. We therefore expect to find ourselves in this position again, and we believe that is the right outcome. The goal is not to capture every cycle. The goal is to own good businesses at prices that do not require the cycle to last forever.


FURTHER INFORMATION
These materials are intended solely for informational purposes. The views expressed reflect the current views of Pzena Investment Management (“PIM”) as of the date hereof and are subject to change. PIM is a registered investment adviser registered with the United States Securities and Exchange Commission. PIM does not undertake to advise you of any changes in the views expressed herein. There is no guarantee that any projection, forecast, or opinion in this material will be realized. Past performance does not predict future returns.
All investments involve risk, including loss of principal. Investments may be in a variety of currencies and therefore changes in rates of exchange between currencies may cause the value of investments to decrease or increase. The price of equity securities may rise or fall because of economic or political changes or changes in a company’s financial condition, sometimes rapidly or unpredictably. Investments in foreign securities involve political, economic and currency risks, greater volatility and differences in accounting methods. These risks are greater for investments in Emerging Markets. Investments in small-cap or mid-cap companies involve additional risks such as limited liquidity and greater volatility than larger companies. PIM’s strategies emphasize a “value” style of investing, which targets undervalued companies with characteristics for improved valuations. This style of investing is subject to the risk that the valuations never improve or that returns on “value” securities may not move in tandem with the returns on other styles of investing or the stock market in general.
This document does not constitute a current or past recommendation, an offer, or solicitation of an offer to purchase any securities or provide investment advisory services and should not be construed as such. The information contained herein is general in nature and does not constitute legal, tax, or investment advice. PIM does not make any warranty, express or implied, as to the information’s accuracy or completeness. Prospective investors are encouraged to consult their own professional advisers as to the implications of making an investment in any securities or investment advisory services.
The specific portfolio securities discussed in this presentation are included for illustrative purposes only and were selected based on their ability to help you better understand our investment process. They were selected from securities in one or more of our strategies and were not selected based on performance. Samsung Electronics, NVIDIA, and Taiwan Semiconductor Manufacturing Co. were held in one or more of our strategies as of June 30, 2026. PIM is a discretionary investment manager and does not make “recommendations” to buy or sell any securities. There is no assurance that any securities discussed herein remain in our portfolios at the time you receive this presentation or that securities sold have not been repurchased.
For EU Investors Only:
This marketing communication is issued by Pzena Investment Management Europe Limited (“PIM Europe”). PIM Europe (No. C457984) is authorised and regulated by the Central Bank of Ireland as a UCITS management company (pursuant to the European Communities (Undertakings for Collective Investment in Transferable Securities) Regulations, 2011, as amended), with additional authorisation for management of portfolios of investments, in accordance with mandates given by investors on a discretionary, client-by-client basis, where such portfolios include one or more of the investment instruments listed in Section C of the Annex to the MiFID (Markets in Financial Instruments) Regulations 2017 (S.I. No. 375 of 2017), as amended), and investment advice concerning one or more of the instruments listed in Annex I, Section C to Directive 2014/65/EU (MiFID II). PIM Europe is registered in Ireland with the Companies Registration Office (No. 699811), with its registered office at Riverside One, Sir John Rogerson’s Quay, Dublin, 2, Ireland. Past performance does not predict future returns. The value of your investment may go down as well as up, and you may not receive upon redemption the full amount of your original investment. The views and statements contained herein are those of Pzena Investment Management and are based on internal research.
For Australia and New Zealand Investors Only:
This document has been prepared and issued by Pzena Investment Management, LLC (ARBN 108 743 415), a limited liability company (“Pzena”). Pzena is regulated by the Securities and Exchange Commission (SEC) under U.S. laws, which differ from Australian laws. Pzena is exempt from the requirement to hold an Australian financial services license in Australia in accordance with ASIC Class Order CO 03/1100 and the transitional relief under ASIC Corporations (Repeal and Transitional) Instrument 2016/396, extended through 31 March 2027 by ASIC Corporations (Foreign Financial Services Providers) Instrument 2025/798. Pzena offers financial services in Australia to ‘wholesale clients’ only pursuant to that exemption. This document is not intended to be distributed or passed on, directly or indirectly, to any other class of persons in Australia.
In New Zealand, any offer is limited to ‘wholesale investors’ within the meaning of clause 3(2) of Schedule 1 of the Financial Markets Conduct Act 2013 (‘FMCA’). This document is not to be treated as an offer, and is not capable of acceptance by, any person in New Zealand who is not a Wholesale Investor.
For South African Investors Only:
The Pzena Emerging Markets Focused Value Fund, Pzena Emerging Markets Select Value Fund, Pzena Global Focused Value Fund, Pzena Global Value Fund are registered and approved under section 65 of CISCA.
Collective Investment Schemes in Securities (CIS) should be considered as medium to long-term investments. The value may go up as well as down and past performance is not necessarily a guide to future performance. CISs are traded at the ruling price and can engage in scrip lending and borrowing. A schedule of fees, charges and maximum commissions is available on request from the Manager. A CIS may be closed to new investors in order for it to be managed more efficiently in accordance with its mandate. There is no guarantee in respect of capital or returns in a portfolio. Representative Office: Prescient Management Company (RF) (Pty) Ltd is registered and approved under the Collective Investment Schemes Control Act (No.45 of 2002). For any additional information such as fund prices, fees, brochures, minimum disclosure documents and application forms please go to www.pzena.com.
© Pzena Investment Management, LLC, 2026. All rights reserved.