


Tracking Error is Not Diversification: How Many Stocks Does Your Index Really Own?
10 min read

Third Quarter 2026 Commentary
Global equity markets have become concentrated around a single theme—AI—leaving indices less diversified than they appear. We believe portfolios built from what this narrative has left behind can offer genuine diversification.
THE INDEX IS NOW A SINGLE THEME
Much has been written about how concentrated equity markets have become. Less attention has been paid to what that concentration has done to diversification. The largest companies in global indices are no longer just big; they are increasingly tied to a single theme—artificial intelligence. As a result, a global index portfolio behaves like a much smaller portfolio than its thousands of holdings suggest. Instead of the broad diversification they sought, many investors have been left with something much narrower: low tracking error. In this essay, we discuss the following:
- How today’s concentration differs from past peaks
- What concentration has done to diversification across global, U.S., and emerging markets indices
- What history and current valuations suggest about forward returns
- Where we are finding opportunity
THE TOP OF THE INDEX IS ONE THEME
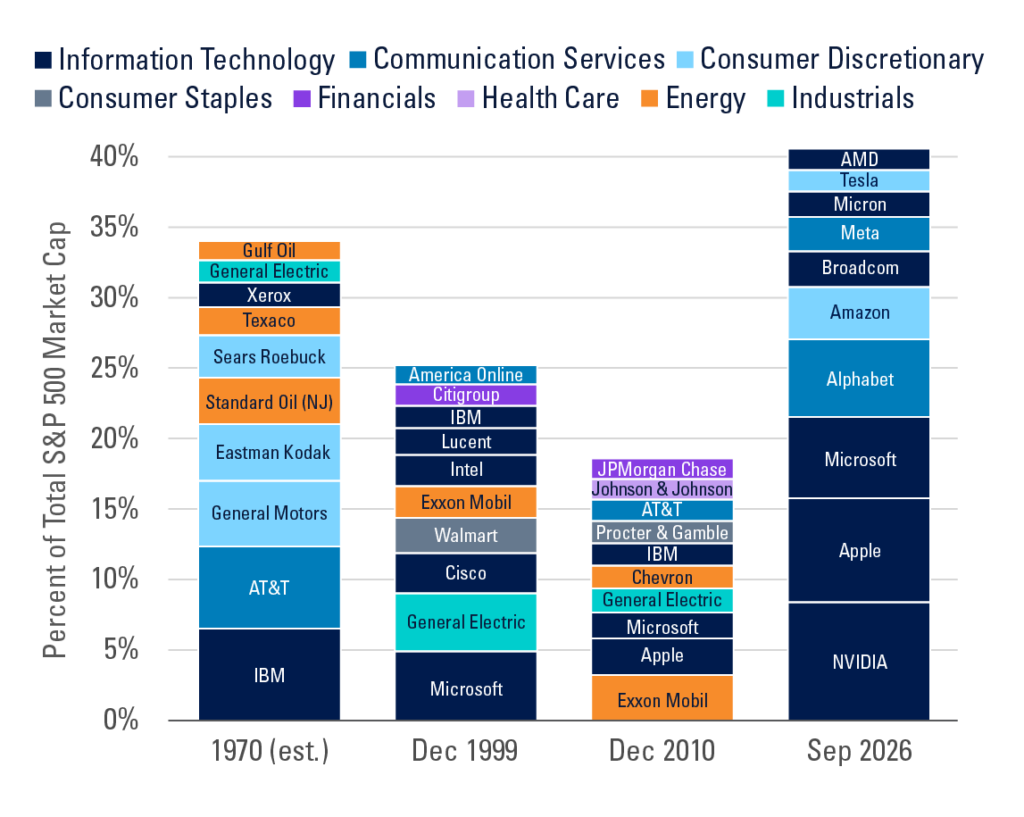
The 10 largest U.S. companies now account for roughly 41% of the S&P 500, and because the U.S. makes up nearly two-thirds of global market capitalization, they increasingly set the course for global indices. At prior peaks of concentration, the largest companies were big but different from one another (Exhibit 1). In 1970, during the Nifty Fifty era, the top 10 spanned computers, telecommunications, autos, photography, energy, and retail. Even when technology led at the height of the dot-com bubble in 2000, the list included an industrial conglomerate, an oil major, a retailer, and a bank.
Today, nine of the 10 largest companies are chip designers, chipmakers, cloud platforms, or consumer technology businesses whose valuations rest heavily on AI-driven growth. The top of the index has become less a collection of industry leaders and more a single theme expressed through nine stocks.
Exhibit 1: Top 10 Companies by Market Cap, 1970–Today
Source: FactSet, Pzena analysis. S&P 500 holdings using current GICS sectors.
1970: company rank order from Arnott, Hsu, and West, The Fundamental Index (Wiley, 2008); bar total from JPMorgan Equity Strategy Research; individual company weights are estimates.
Data as of September 30, 2026.
DIVERSIFICATION IS SHRINKING
A simple way to gauge diversification is to ask how many stocks an index actually behaves like. Consider a portfolio with 90% of its weight in just one of its 10 holdings; on paper, it holds 10 stocks, but in practice, it behaves like a portfolio of little more than one. The Effective N metric captures this. Calculated as one divided by the Herfindahl-Hirschman Index, a standard measure of concentration, it is the number of equally weighted stocks that would be just as concentrated as the portfolio.
By this measure, diversification has fallen sharply across regions (Exhibit 2). Since 2012, the effective number of stocks in global, U.S., and emerging markets indices has fallen to between roughly one-sixth and one-third of what it was. The MSCI All Country World Index (ACWI), an index of around 2,400 companies, now behaves like a portfolio of little more than 100.
Exhibit 2: The Index Behaves like a Smaller Portfolio
Korea + Taiwan = 113% of Total Return (Total EM Return: +24%)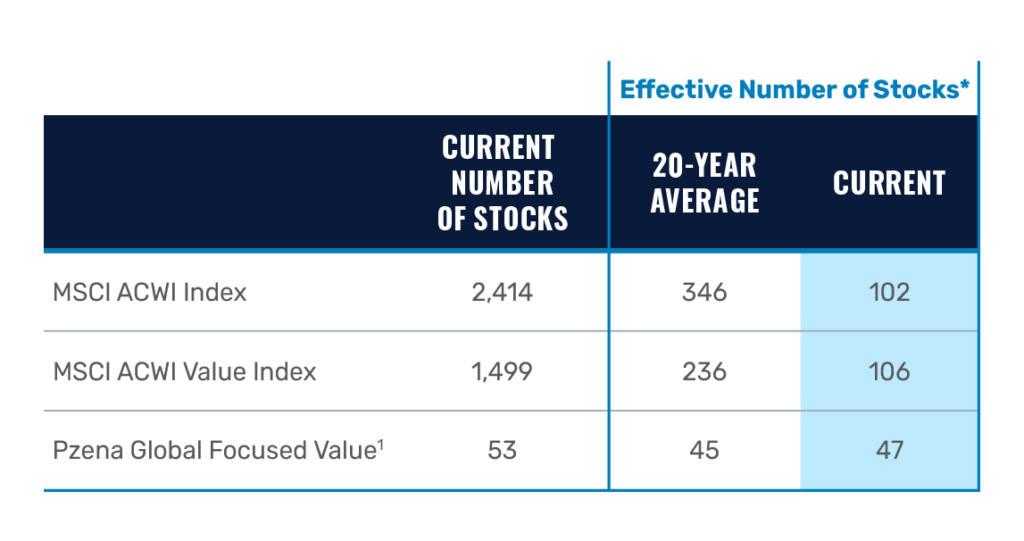
Source: FactSet, MSCI, Pzena analysis
*Effective number of stocks = 1/HHI, where the Herfindahl-Hirschman Index (HHI) = Σ(wᵢ²) and wᵢ is each security’s weight in the index or portfolio, expressed as a decimal. The effective number of stocks is the number of equally weighted holdings that would produce the same level of concentration; lower values indicate greater concentration.
Data from September 30, 2006 – September 30, 2026 on a monthly frequency.
1 Data is based on representative client accounts.
Emerging markets have seen the steepest decline, as a rally in a small group of Asian semiconductor companies pushed their weights higher. As a result, our Emerging Markets Focused Value strategy portfolio, a concentrated portfolio of 40–80 stocks, is now more diversified in effective terms than its benchmark.
Even these figures may overstate true diversification. Diversification is not just about the number of stocks; it’s also about the different kinds of risk those stocks represent. Effective N counts nine AI-linked companies as nine separate positions, yet their fortunes depend largely on the same driver: continued spending on AI.
This is where the trade-off becomes clear. Close alignment with the index minimizes tracking error, and for many investors that has become the goal. But low tracking error and diversification were never the same thing, and today, the difference is hard to ignore. A portfolio managed for closeness to the benchmark can end up concentrated in a single theme. Diversification comes from owning businesses whose earnings depend on different drivers.
HISTORY HAS NOT FAVORED THE LARGEST
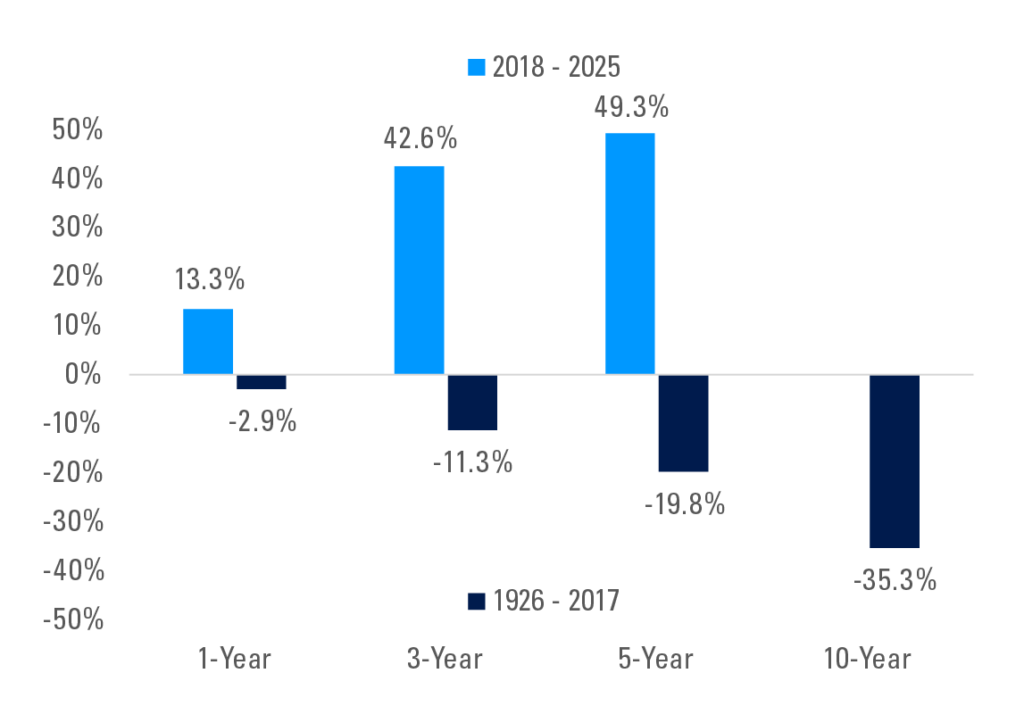
Concentration would matter less if the largest companies reliably kept outperforming. History suggests otherwise. From 1926 through 2017, the 10 largest S&P 500 companies trailed the equal-weighted index by an average of 2.9% over the following year, 11.3% over three years, 19.8% over five years, and 35.3% over ten years (Exhibit 3).
The period since 2018 has been a striking exception. The largest companies outperformed by an average of 13.3%, 42.6%, and 49.3% over the following one, three, and five years. This explains why the index looks the way it does today.
To be fair, this exception has been earned, at least in part. Many of today’s largest companies have delivered extraordinary earnings growth, and the digital economy has rewritten some of the rules of scaling. Businesses built on software, platforms, and network effects can grow without the capital burdens that once held incumbents back. But the price paid for a business still matters. Even exceptional companies can make disappointing investments when the price already reflects their success.
Exhibit 3: The 10 Largest S&P 500 Stocks Have Historically Underperformed by a Wide Margin
Average Relative 1, 3, 5, 10-Year Forward Performance of the 10 Largest S&P 500 Companies*
 Source: Robert D. Arnott, Jason C. Hsu, and John M. West, The Fundamental Index: A Better Way to Invest. John Wiley & Sons, Inc. 2008, Research Affiliates, LLC., Sanford C. Bernstein & Co., Pzena analysis
*Equally weighted returns of the 10 largest S&P 500 companies by market capitalization vs. the equal-weighted S&P 500 universe.
The 2018 – 2025 bars reflect relative returns for periods ending each year from 2018 through 2025, or eight annual observations for each time period.
Rolling annual data as of December 31, 2025. Past performance does not predict future returns.
VALUATIONS SET THE STARTING POINT
Today, that price is high. Concentration at the top has left indices richly valued relative to their own history. The forward price-to-earnings (P/E) ratio for global equities stands at more than 19x, roughly 16% above its long-term average.
History offers no guarantees about timing, but periods that began from elevated valuations have not always been followed by strong returns.
Our portfolios tell a different story. While the market trades well above its historical valuation range, our Global Focused Value portfolio trades at 7.4x normalized earnings, below its long-term average of 7.9x.
WHERE WE ARE FINDING OPPORTUNITY
That gap is not the result of a macro call against AI. It is the product of the same bottom-up process we have always followed.
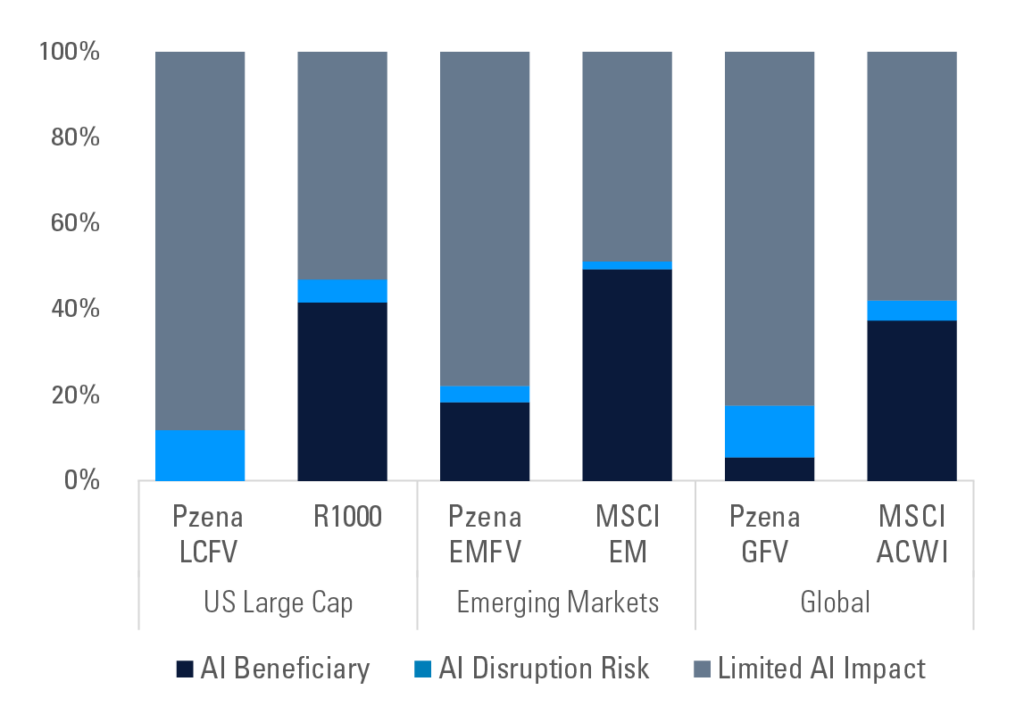
The vast majority of our exposure is to companies where we expect AI to have limited impact on earnings, in either direction (Exhibit 4). In our Global Focused Value portfolio, that share is roughly 82%, compared with about 58% for ACWI. The contrast holds across regions and is widest in the U.S., where our U.S. Large Cap Focused Value portfolio has almost no exposure to companies benefiting from the AI buildout, while nearly 42% of the Russell 1000 falls in that category.
Exhibit 4: Broad-Based Opportunities Outside AI
AI Exposure: Pzena Vs. Indices
Source: FactSet, FTSE Russell, MSCI, Pzena analysis.
Data as of September 30, 2026. Portfolio and index weights by AI category. Pzena Large Cap Focused Value vs. Russell 1000 Index; Pzena Emerging Markets Focused Value vs. MSCI Emerging Markets Index; Pzena Global Focused Value vs. MSCI ACWI Index. Portfolio data based on a representative account. AI categories are Pzena’s classifications, assigned by sub-industry (FTSE ICB for Russell; GICS for MSCI) with company-level adjustments. AI Beneficiary: suppliers of the AI buildout. AI Disruption Risk: businesses whose products AI could substitute for. Limited AI Impact: all others. Classifications are subjective and subject to change. Holdings are subject to change and are not a recommendation to buy or sell any security.
We have found little to buy among AI beneficiaries, which has been a function of price, not conviction. We built our exposure to memory semiconductors when the industry was out of favor and trimmed it as prices rose.
We have also taken modest, thoughtful positions in companies we believe the market has overly punished for perceived AI risk, most notably in IT and business services. Our research suggests the market has priced in worst-case outcomes for businesses that have adapted to prior waves of technological change. Because the range of outcomes is wider than usual, we have sized these positions carefully.
Our portfolios often carry meaningful tracking error relative to the index, which we believe is particularly valuable in the current market environment. For investors whose core exposures have converged on the same small group of stocks, portfolios that look very different, and whose results depend on different drivers, can serve as a genuinely diversifying complement to what they already own.
CONCLUSION
The concentration of today’s market is not simply a question of size. It is also a question of correlation. The largest companies in global indices are increasingly rising and falling on a single narrative. Sound portfolio construction has always meant avoiding too much exposure to any single risk. Yet for investors who rely on the index for diversification, a single risk is increasingly what they hold, at a time when valuations are well above historical averages. We do not know when or how this concentration will ease; historically, it has only needed to stop rising, not reverse, to improve the environment for active and value strategies. In the meantime, we believe the most attractive opportunities lie in the parts of the market this narrative has left behind. Portfolios built from that opportunity set can offer investors something the index increasingly cannot: diversification.



FURTHER INFORMATION
These materials are intended solely for informational purposes. The views expressed reflect the current views of Pzena Investment Management (“PIM”) as of the date hereof and are subject to change. PIM is a registered investment adviser registered with the United States Securities and Exchange Commission. PIM does not undertake to advise you of any changes in the views expressed herein. There is no guarantee that any projection, forecast, or opinion in this material will be realized. Past performance does not predict future returns.
All investments involve risk, including loss of principal. Investments may be in a variety of currencies and therefore changes in rates of exchange between currencies may cause the value of investments to decrease or increase. The price of equity securities may rise or fall because of economic or political changes or changes in a company’s financial condition, sometimes rapidly or unpredictably. Investments in foreign securities involve political, economic and currency risks, greater volatility and differences in accounting methods. These risks are greater for investments in Emerging Markets. Investments in small-cap or mid-cap companies involve additional risks such as limited liquidity and greater volatility than larger companies. PIM’s strategies emphasize a “value” style of investing, which targets undervalued companies with characteristics for improved valuations. This style of investing is subject to the risk that the valuations never improve or that returns on “value” securities may not move in tandem with the returns on other styles of investing or the stock market in general.
This document does not constitute a current or past recommendation, an offer, or solicitation of an offer to purchase any securities or provide investment advisory services and should not be construed as such. The information contained herein is general in nature and does not constitute legal, tax, or investment advice. PIM does not make any warranty, express or implied, as to the information’s accuracy or completeness. Prospective investors are encouraged to consult their own professional advisers as to the implications of making an investment in any securities or investment advisory services.
For EU Investors Only:
This marketing communication is issued by Pzena Investment Management Europe Limited (“PIM Europe”). PIM Europe (No. C457984) is authorised and regulated by the Central Bank of Ireland as a UCITS management company (pursuant to the European Communities (Undertakings for Collective Investment in Transferable Securities) Regulations, 2011, as amended), with additional authorisation for management of portfolios of investments, in accordance with mandates given by investors on a discretionary, client-by-client basis, where such portfolios include one or more of the investment instruments listed in Section C of the Annex to the MiFID (Markets in Financial Instruments) Regulations 2017 (S.I. No. 375 of 2017), as amended), and investment advice concerning one or more of the instruments listed in Annex I, Section C to Directive 2014/65/EU (MiFID II). PIM Europe is registered in Ireland with the Companies Registration Office (No. 699811), with its registered office at Riverside One, Sir John Rogerson’s Quay, Dublin, 2, Ireland. Past performance does not predict future returns. The value of your investment may go down as well as up, and you may not receive upon redemption the full amount of your original investment. The views and statements contained herein are those of Pzena Investment Management and are based on internal research.
For Australia and New Zealand Investors Only:
This document has been prepared and issued by Pzena Investment Management, LLC (ARBN 108 743 415), a limited liability company (“Pzena”). Pzena is regulated by the Securities and Exchange Commission (SEC) under U.S. laws, which differ from Australian laws. Pzena is exempt from the requirement to hold an Australian financial services license in Australia in accordance with ASIC Class Order CO 03/1100 and the transitional relief under ASIC Corporations (Repeal and Transitional) Instrument 2016/396, extended through 31 March 2027 by ASIC Corporations (Foreign Financial Services Providers) Instrument 2025/798. Pzena offers financial services in Australia to ‘wholesale clients’ only pursuant to that exemption. This document is not intended to be distributed or passed on, directly or indirectly, to any other class of persons in Australia.
In New Zealand, any offer is limited to ‘wholesale investors’ within the meaning of clause 3(2) of Schedule 1 of the Financial Markets Conduct Act 2013 (‘FMCA’). This document is not to be treated as an offer, and is not capable of acceptance by, any person in New Zealand who is not a Wholesale Investor.
For South African Investors Only:
The Pzena Emerging Markets Focused Value Fund, Pzena Emerging Markets Select Value Fund, Pzena Global Focused Value Fund, Pzena Global Value Fund are registered and approved under section 65 of CISCA.
Collective Investment Schemes in Securities (CIS) should be considered as medium to long-term investments. The value may go up as well as down and past performance is not necessarily a guide to future performance. CISs are traded at the ruling price and can engage in scrip lending and borrowing. A schedule of fees, charges and maximum commissions is available on request from the Manager. A CIS may be closed to new investors in order for it to be managed more efficiently in accordance with its mandate. There is no guarantee in respect of capital or returns in a portfolio. Representative Office: Prescient Management Company (RF) (Pty) Ltd is registered and approved under the Collective Investment Schemes Control Act (No.45 of 2002). For any additional information such as fund prices, fees, brochures, minimum disclosure documents and application forms please go to www.pzena.com.
© Pzena Investment Management, LLC, 2026. All rights reserved.