


The Case for EM Value
Updated February 2026

For Bargains, Investors Should Look to Emerging Markets
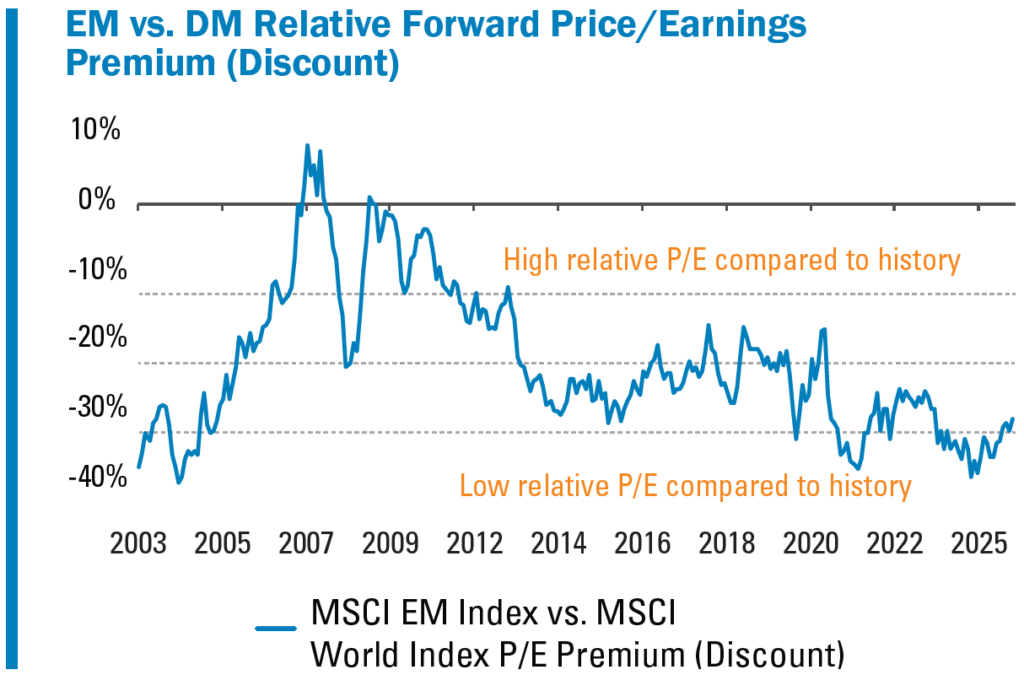
Emerging markets have underperformed developed markets for the better part of the post-GFC era, even if the U.S. is excluded; thus, despite the sizable outperformance of emerging-market (EM) stocks in 2025, the relative valuation gap remains near historically wide levels.
Source: FactSet, Pzena analysis
FY1 data per FactSet from June 30, 2003 – December 31, 2025.
Aside from the post-pandemic digital economy boom, which saw US tech valuations explode, EM stocks’ discount to their developed market peers hasn’t been this material since 2005, immediately preceding close to a decade of outperformance for emerging markets.
 Source: FactSet, Pzena analysis
Total return data in US dollars from January 1, 1988 – December 31, 2025. All data points end in December. Past performance does not predict future returns.
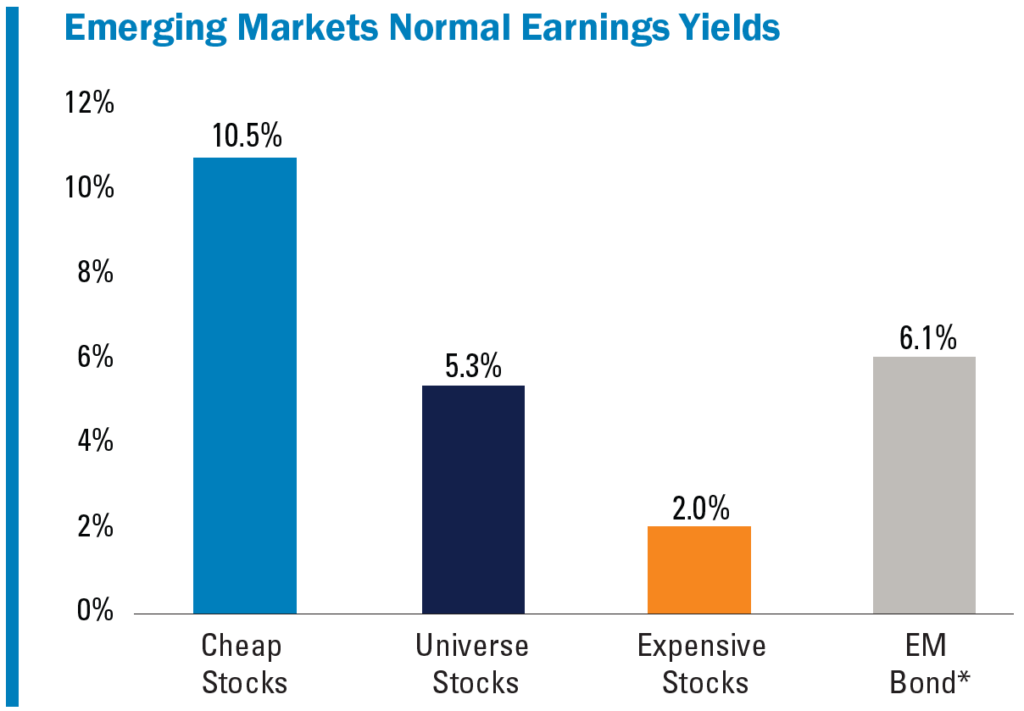
EM VALUE STOCKS ARE HIGHLY DISCOUNTED
EM relative valuation as a broad asset class is compelling, and within the non-developed universe, value stocks look particularly attractive. The cheapest EM stocks offer normalized earnings yields of approximately 10.5% compared with 2.0% for the most expensive stocks and 6.1% for EM bonds. We believe the cheapest quintile is precisely where investors can source the highest risk-adjusted long-term returns.
Source: Pzena analysis
Cheap/Expensive earnings yield are based on the median stock within the cheapest and most expensive quintile based on price-to-normal earnings. The quintiles are measured on an equally weighted basis within the ~1,500 largest non-developed stock universe. Price-to-normal earnings are Pzena’s estimates. Universe stocks is the earnings yield of the median stock within the entire universe. Does not represent any specific Pzena product or service.
*Yield of the Bloomberg Emerging Markets USD Aggregate (7-10 Y) Index. The index includes fixed- and floating-rate US dollar-denominated debt issued by sovereign, quasi-sovereign, and corporate EM issuers.
Data as of December 31, 2025.
WHY EM + VALUE HAS HISTORICALLY WORKED WELL
Perhaps because developing nations often post higher GDP growth rates than their developed peers, many market practitioners view EM investing as a growth story; however, the value approach has historically delivered higher risk-adjusted returns, as evidenced by the risk-adjusted return metrics segregated by valuation quintiles shown below.
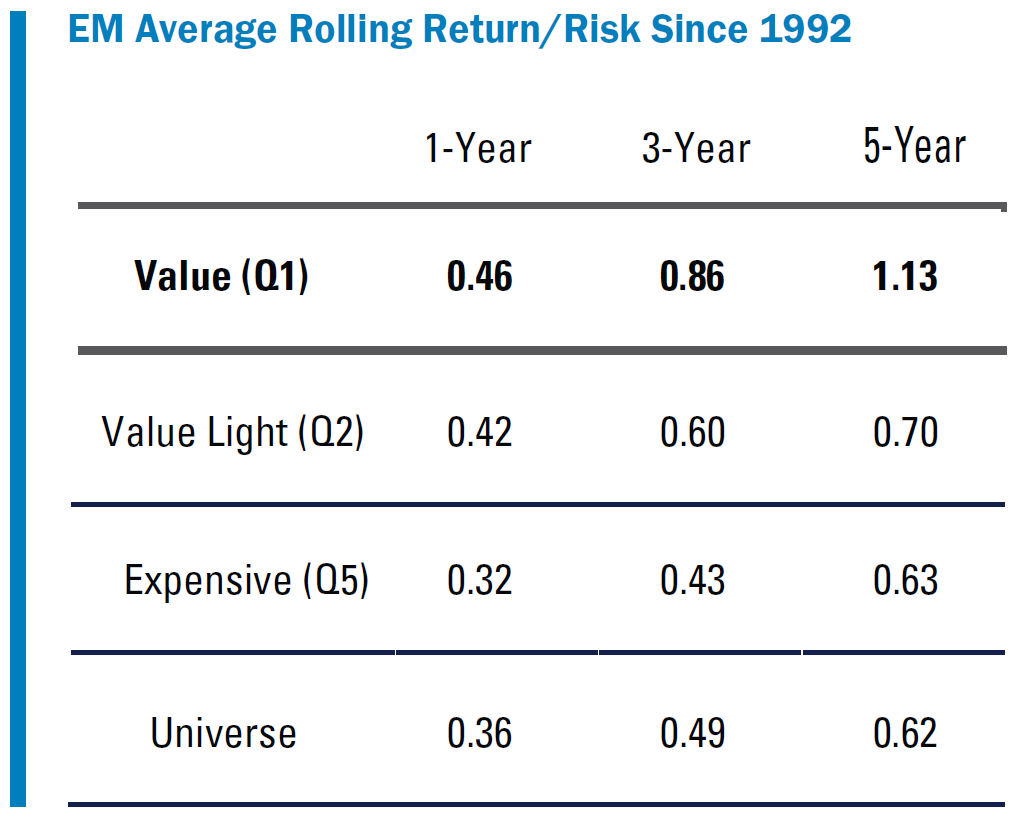
Source: Sanford C. Bernstein & Co., Pzena analysis
Return/Risk = Average rolling return divided by the standard deviation of the rolling returns. Value = stocks within the cheapest quintile based on price/book of the MSCI EM universe. Value Light = 2nd cheapest quintile. Expensive = most expensive quintile. The quintiles are measured on an equally weighted basis. Universe = cap-weighted returns of MSCI EM universe.
Total return US dollar data from January 1, 1992 – December 31, 2025.
Does not represent any specific Pzena product or service. Past performance does not predict future returns.
Higher-beta emerging markets understandably endure more frequent bouts of volatility, but offer amplified return potential for value investors. We believe this is due to four key factors:
- Psychology – Investors tend to exaggerate the significance of near-term problems, effectively discounting the potential for business, industry, management, currency, or macroeconomic improvements over time. Active value managers can exploit these overly emotional responses, which are more prominent in emerging markets.
- Earnings power – Despite the lack of empirical evidence, investors often inextricably link stock markets to economies, associating GDP growth with higher equity returns. When growth-seeking investors pay up for expectations of future growth, their reactions to disappointment can present a fertile hunting ground for disciplined value investors.
- Wide range of outcomes – The array of political and legal structures, currencies, and governance practices each add to the complexity of EM investing, offering robust opportunities across a large pool of stocks.
- Under-exploitation – Most investment managers tend to favor macroeconomic or quantitative approaches to EM investing, resulting in crowded trades and wider market swings that result in exploitable price dislocations.
These factors frequently arise in emerging markets, at times giving rise to situations that some investors may regard as ‘uninvestable.’ For disciplined, research-driven value investors, such dislocations present opportunities to purchase fundamentally strong businesses with low expectations, at attractive valuations, and we firmly believe valuation is the single best determinant of long-term outperformance in any geography. Value works particularly well in emerging economies because these valuation opportunities are more prevalent, rendering the growth style less effective.
Over approximately the past three decades, the five-year rolling returns for deep value stocks outpaced the market 77% of the time, resulting in average annualized outperformance of 7.7%. Because risk mitigation is top of mind for many EM investors, we analyzed the performance data throughout different market conditions and discovered that even in down markets, the cheapest quintile meaningfully outperformed. This illustration demonstrates what our research has shown more broadly: following extreme periods of market stress, deep value stocks have historically tended to outperform by a wide margin.
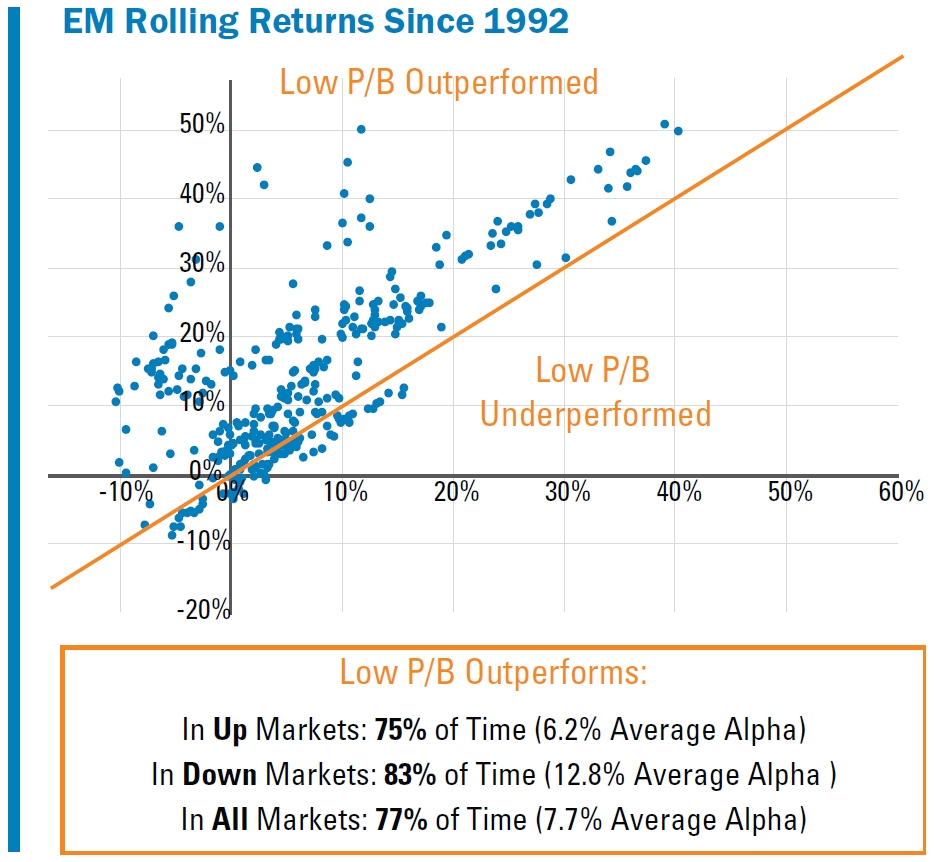
Y axis: Monthly rolling 5-year USD annualized return of Low Price/Book*
X axis: Monthly rolling 5-year USD annualized return of MSCI Emerging Markets Index (gross returns)
Source: MSCI, Sanford C. Bernstein & Co., Pzena analysis
*Cheapest quintile price to book of MSCI EM universe (equal-weighted data); Does not represent any specific Pzena product or service. Data through December 31, 2025.
Past performance does not predict future returns.
IS EM INVESTING A LEVERAGE PLAY?
EM-domiciled companies aren’t necessarily riskier than developed market businesses from a corporate leverage standpoint. Debt levels vary by industry and business model, but in aggregate at the index level, EM companies are 0.77x levered (net debt/EBITDA as of December 2025), compared to 1.44x for U.S.-domiciled companies . Nearly half of our non-financial portfolio companies have net cash positions on their balance sheets, i.e., no net debt, and our strategy’s average leverage ratio (non-financial companies) is 0.56x.
ARE EM VALUE STOCKS TOO VOLATILE?
The return distribution of value stocks significantly narrows over longer time horizons, with historical performance skewed to the upside. While short-term fluctuations in these markets may appear intense, examining the asymmetry of this volatility reveals its upside potential.
Source: Sanford C. Bernstein & Co., Pzena analysis
Value = stocks within the cheapest quintile based on price/book of the MSCI EM universe (Equal Weighted). Universe = cap-weighted returns of MSCI EM universe.
Total return US dollar data from January 1, 1992 – December 31, 2025. Does not represent any specific Pzena product or service. Past performance does not predict future returns.
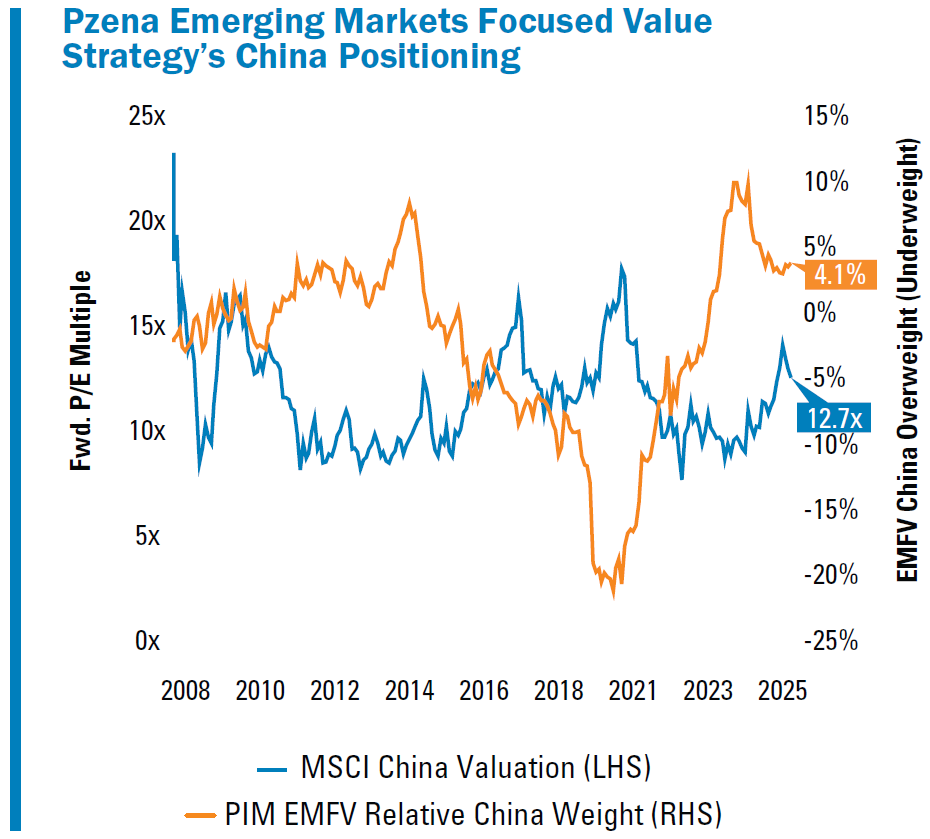
EXPLOITING EM VALUE OPPORTUNITIES
Emerging markets are inherently disparate, with each country possessing unique risks. Our Emerging Markets Focused Value portfolio, for example, is currently invested in 20 countries, reflecting a diverse opportunity set. Whether fear-induced selloffs are driven by geopolitical tensions, commodity price inflation, or exogenous events such as the COVID-19 pandemic, the resulting volatility often presents opportunities for disciplined value investors.
Brazil has become a fertile hunting ground for value over the past few years. While the Brazilian equity market has recently been under pressure, some key macroeconomic indicators present a more constructive picture than market sentiment suggests. The unemployment rate is at a 10-year low, and inflation remains materially below the double-digit percentages of 2021 and 2022. Despite this relatively benign economic backdrop, the pricing of Brazilian equities appears to reflect a negative outlook, with the drawdown largely driven by political concerns. As the market multiple has approached single digit territory, we have steadily and selectively increased our exposure to companies that we believe to be particularly cheap on a normalized earnings basis.
Source: FactSet, Pzena analysis
Pzena Emerging Markets Focused Value Composite estimate; relative China weight versus MSCI EM Index (includes both China and Hong Kong).
MSCI China valuation uses FY1 P/E. Data from January 1, 2008 – December 31, 2025.
Our Brazilian holdings include Companhia Energética de Minas Gerais (CEMIG), a diversified power company with defensive characteristics and an attractive dividend yield; Vale, a global mining leader known for disciplined capital allocation and strong shareholder returns; Ambev, Latin America’s largest brewer with a strong balance sheet and consistent cash generation; Itaú Unibanco, one of Brazil’s largest private banks with strong return on equity and disciplined cost management; and Banco do Brasil, a state-controlled bank demonstrating improving profitability and credit quality.
CONCLUSION
EM selloffs can be severe, leading to share prices that decouple from the broad index and often creating an asymmetric risk/reward profile. Individual countries, however, do generally recover, and good businesses find ways to navigate crises. As valuation-focused investors, we see these collapsing stock prices as compelling opportunities to begin deep fundamental company-level research, seeking to identify strong franchises unduly punished by a sweeping reaction to temporary issues.


Further Information
These materials are intended solely for informational purposes. The views expressed reflect the current views of Pzena Investment Management (“PIM”) as of the date hereof and are subject to change. PIM is a registered investment adviser registered with the United States Securities and Exchange Commission. PIM does not undertake to advise you of any changes in the views expressed herein. There is no guarantee that any projection, forecast, or opinion in this material will be realized. Past performance does not predict future returns.
All investments involve risk, including loss of principal. Investments may be in a variety of currencies and therefore changes in rates of exchange between currencies may cause the value of investments to decrease or increase. The price of equity securities may rise or fall because of economic or political changes or changes in a company’s financial condition, sometimes rapidly or unpredictably. Investments in foreign securities involve political, economic and currency risks, greater volatility and differences in accounting methods. These risks are greater for investments in Emerging Markets. Investments in small-cap or mid-cap companies involve additional risks such as limited liquidity and greater volatility than larger companies. PIM’s strategies emphasize a “value” style of investing, which targets undervalued companies with characteristics for improved valuations. This style of investing is subject to the risk that the valuations never improve or that returns on “value” securities may not move in tandem with the returns on other styles of investing or the stock market in general.
This document does not constitute a current or past recommendation, an offer, or solicitation of an offer to purchase any securities or provide investment advisory services and should not be construed as such. The information contained herein is general in nature and does not constitute legal, tax, or investment advice. PIM does not make any warranty, express or implied, as to the information’s accuracy or completeness. Prospective investors are encouraged to consult their own professional advisers as to the implications of making an investment in any securities or investment advisory services.
The MSCI information may only be used for internal use, may not be reproduced or redisseminated in any form and may not be used as a basis for or a component of any financial instruments or products or indices. None of the MSCI information is intended to constitute investment advice or a recommendation to make (or refrain from making) any kind of investment decision and may not be relied on as such. Historical data and analysis should not be taken as an indication or guarantee of any future performance analysis, forecast or prediction. The MSCI information is provided on an “as is” basis and the user of this information assumes the entire risk of any use made of this information. MSCI, each of its affiliates and each other person involved in or related to compiling, computing or creating any MSCI information (collectively, the MSCI Parties) expressly disclaims all warranties (including, without limitation, any warranties of originality, accuracy, completeness, timeliness, non-infringement, merchantability and fitness for a particular purpose) with respect to this information. Without limiting any of the foregoing, in no event shall any MSCI party have any liability for any direct, indirect, special, incidental, punitive, consequential (including, without limitation, lost profits) or any other damages.
For U.K. Investors Only:
This marketing communication is issued by Pzena Investment Management, Ltd. (“PIM UK”). PIM UK is a limited company registered in England and Wales with registered number 09380422, and its registered office is at 34-37 Liverpool Street, London EC2M 7PP, United Kingdom. PIM UK is an appointed representative of Vittoria & Partners LLP (FRN 709710), which is authorised and regulated by the Financial Conduct Authority (“FCA”). The Pzena documents have been approved by Vittoria & Partners LLP and, in the UK, are only made available to professional clients and eligible counterparties as defined by the FCA.
For Jersey Investors Only:
Consent under the Control of Borrowing (Jersey) Order 1958 (the “COBO” Order) has not been obtained for the circulation of this document. Accordingly, the offer that is the subject of this document may only be made in Jersey where the offer is valid in the United Kingdom or Guernsey and is circulated in Jersey only to persons similar to those to whom, and in a manner similar to that in which, it is for the time being circulated in the United Kingdom, or Guernsey, as the case may be. The directors may, but are not obliged to, apply for such consent in the future. The services and/or products discussed herein are only suitable for sophisticated investors who understand the risks involved. Neither Pzena Investment Management, Ltd. nor Pzena Investment Management, LLC nor the activities of any functionary with regard to either Pzena Investment Management, Ltd. or Pzena Investment Management, LLC are subject to the provisions of the Financial Services (Jersey) Law 1998.
For EU Investors Only:
This marketing communication is issued by Pzena Investment Management Europe Limited (“PIM Europe”). PIM Europe (No. C457984) is authorised and regulated by the Central Bank of Ireland as a UCITS management company (pursuant to the European Communities (Undertakings for Collective Investment in Transferable Securities) Regulations, 2011, as amended). PIM Europe is registered in Ireland with the Companies Registration Office (No. 699811), with its registered office at Riverside One, Sir John Rogerson’s Quay, Dublin, 2, Ireland. Past performance does not predict future returns. The value of your investment may go down as well as up, and you may not receive upon redemption the full amount of your original investment. The views and statements contained herein are those of Pzena Investment Management and are based on internal research.
For Australia and New Zealand Investors Only:
This document has been prepared and issued by Pzena Investment Management, LLC (ARBN 108 743 415), a limited liability company (“Pzena”). Pzena is regulated by the Securities and Exchange Commission (SEC) under U.S. laws, which differ from Australian laws. Pzena is exempt from the requirement to hold an Australian financial services license in Australia in accordance with ASIC Class Order CO 03/1100 and the transitional relief under ASIC Corporations (Repeal and Transitional) Instrument 2016/396, extended through 31 March 2027 by ASIC Corporations (Foreign Financial Services Providers) Instrument 2025/798. Pzena offers financial services in Australia to ‘wholesale clients’ only pursuant to that exemption. This document is not intended to be distributed or passed on, directly or indirectly, to any other class of persons in Australia.
In New Zealand, any offer is limited to ‘wholesale investors’ within the meaning of clause 3(2) of Schedule 1 of the Financial Markets Conduct Act 2013 (‘FMCA’). This document is not to be treated as an offer, and is not capable of acceptance by, any person in New Zealand who is not a Wholesale Investor.
© Pzena Investment Management, LLC, 2026. All rights reserved.