

Physical Climate Risk Primer

01. TERMINOLOGY DEFINED
INTRODUCTION
Physical climate risk presents a potential threat to corporate value, with implications for companies and investors. By understanding how and where these risks materialize, companies can begin to adapt their businesses to withstand the physical impacts of climate change, and investors can better understand the balance between risk and resilience at the company and portfolio levels.
PHYSICAL CLIMATE RISK
Physical climate risk refers to the impacts from the direct, tangible effects of a changing climate. It encompasses the wide range of damages that result from environmental disruptions. It differs from transition risk, which includes the impact of societal, economic, and policy shifts toward a low-carbon economy.
The Taskforce on Climate Related Financial Disclosure (TCFD) breaks physical climate risk into two categories: acute and chronic.
- Acute physical climate risk is event-driven, resulting from the increasing frequency and intensity of extreme weather events such as hurricanes, floods, wildfires, and cyclones.
- Chronic physical climate risk is long-term, emerging gradually, as shifts in climate patterns like temperature and sea level rise continue.
CLIMATE ADAPTATION
Climate adaptation refers to the process of adjusting systems, infrastructure, and practices to better withstand physical climate impacts. Adaptation measures include a range of solutions, from man-made protective walls that combat rising sea levels to nature-based concepts, such as replanting habitats to recover ecosystem services.
CLIMATE RESILIENCE
Climate resilience is the end goal, bridging the gap between mitigation and adaptation. Mitigation efforts that reduce greenhouse gases are increasingly recognized to be insufficient; adaptation strategies are also needed to fully recover from climate-related disruptions. Climate resilience depends in part on maintaining the resilience of natural ecosystems, as these often provide the first line of defense against the exacerbated impacts of climate change.
02. FINANCIAL MATERIALITY
Physical climate risk can become financially material for companies in the following ways. Increasingly, companies are talking about these risks in terms of “enterprise value-at-risk.”
- Stranded assets/asset devaluation – Existing assets may lose value or be forced into early shutdowns, leading to write-offs in high-risk regions. Some assets may also become uninsurable over time, which poses the risk of greater future financial losses.
- Elevated costs of goods and services – Supply chain interruptions and rising operating expenses (such as increased insurance costs) can drive prices up.
- Capital ratios – The financial stability and solvency of banks and insurers may be threatened by growing climate-related risks.
- Availability of financing – Investments may become harder to secure in areas with higher seasonal or environmental risk.
- Bottom-line revenue – Production levels may fall due to disruptions in operations or supply chains, reducing overall profits.
PORTFOLIO EXAMPLES
Gildan Activewear
In 2018, Hurricane Florence temporarily shut down Gildan’s distribution operations in the Carolinas. Similarly, in November 2020, Hurricanes Eta and Iota forced the temporary closure of their manufacturing hub in Honduras and Nicaragua due to flooding and power outages. The company incurred tens of millions of dollars in losses*.
BASF
Extremely low water levels in the Rhine River around 2018, caused by drought and high temperatures, disrupted BASF’s chemical complex, limiting the transport of raw materials and products and halting production. The company reported losses of approximately €200–250 million due to decreased production and increased logistics costs*.
*Source: Pzena Analysis
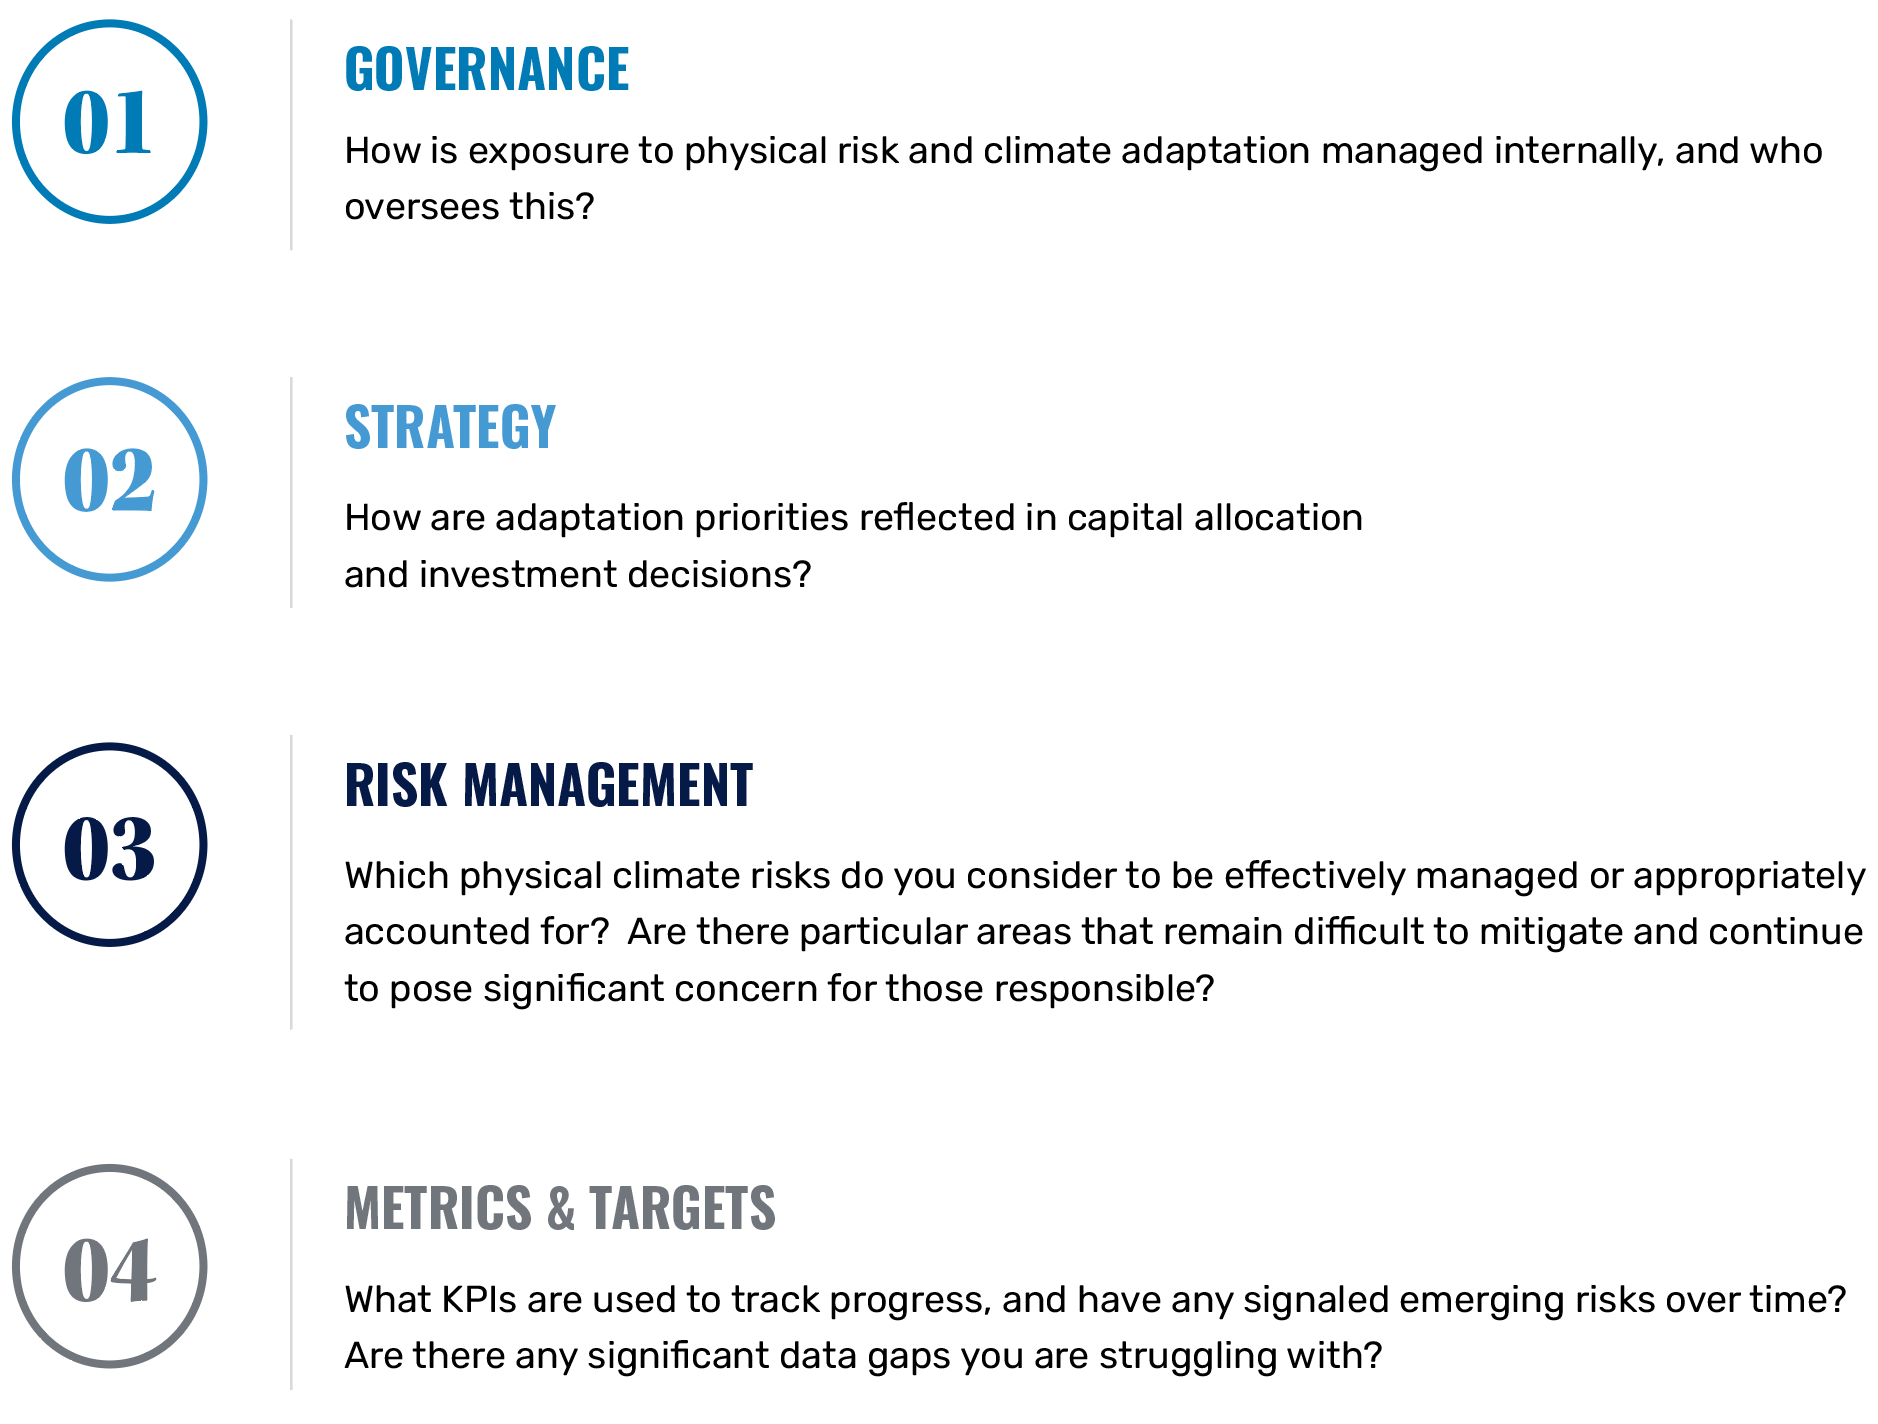
03. ENGAGEMENT FRAMEWORK
04. SECTOR DEEP DIVE
While there is the potential for physical climate risk to affect all sectors, some sectors are likely to have more “enterprise value-at-risk” from the physical impacts of climate change in the shorter to medium term, by virtue of their operations. The following table outlines sectors where we may see these key risks materialize first.
| SECTOR | EXAMPLES OF KEY PHYSICAL CLIMATE RISKS |
| Utilities / Energy |
|
| Agriculture |
|
| Real Estate |
|
| Industrials |
|
| Financials |
|
| Chemicals |
|
| Healthcare |
|
Agriculture: Barry Callebaut
As previously detailed, climate change poses serious and direct risks to the agriculture industry. Some estimates suggest that, globally, agriculture has experienced approximately one-quarter of all economic losses resulting from climate events1, magnified to a greater degree in developing and more vulnerable regions.
Exposure to physical climate risk is therefore one of the issues we assess when researching a company in the agriculture industry. For example, we recently invested in global chocolate processor Barry Callebaut, which operates in regions such as West Africa, where physical climate risk manifests as changing weather patterns and increasingly unpredictable cocoa harvests.
When we explored this issue as part of our due diligence prior to making the investment, we learned that Barry Callebaut is successfully adapting to physical climate risk, primarily through supporting systems of agroforestry in its supply chain. The goal of agroforestry is to maintain land health and biodiversity. For example, a farmer may plant multiple shady trees alongside the cocoa plant; this provides a natural shield, strengthening the cocoa plant’s productivity and resilience by protecting it from excessive heat while also enriching the soil with nutrients. Additionally, agroforestry can provide multiple revenue streams for farmers who may operate under difficult financial conditions.
Financing climate adaptation remains one of the greatest challenges, particularly in agriculture, an industry dominated by independent smallholders across diverse regions. Many smallholders lack access to the resources needed to adopt climate-resilient farming measures. This provides an opportunity for larger companies, like Barry Callebaut, to help bridge the financing gap in its supply chain.
Exposure to physical climate risk did not preclude us from investing in Barry Callebaut because we were comfortable with the company’s approach to mitigation and adaptation. We will continue to engage on this topic to make sure we remain confident in Barry Callebaut’s ability to manage its risk exposure.
Footnotes
- UN Environment Program Finance Initiative


Further information
These materials are intended solely for informational purposes. The views expressed reflect the current views of Pzena Investment Management, LLC (“PIM”) as of the date hereof and are subject to change. PIM is a registered investment adviser registered with the United States Securities and Exchange Commission. PIM does not undertake to advise you of any changes in the views expressed herein. There is no guarantee that any projection, forecast, or opinion in this material will be realized. Past performance does not predict future returns.
All investments involve risk, including loss of principal. The price of equity securities may rise or fall because of economic or political changes or changes in a company’s financial condition, sometimes rapidly or unpredictably. Investments in foreign securities involve political, economic and currency risks, greater volatility and differences in accounting methods. These risks are greater for investments in Emerging Markets. Investments in small-cap or mid-cap companies involve additional risks such as limited liquidity and greater volatility than larger companies. PIM’s strategies emphasize a “value” style of investing, which targets undervalued companies with characteristics for improved valuations. This style of investing is subject to the risk that the valuations never improve or that returns on “value” securities may not move in tandem with the returns on other styles of investing or the stock market in general.
This document does not constitute a current or past recommendation, an offer, or solicitation of an offer to purchase any securities or provide investment advisory services and should not be construed as such. The information contained herein is general in nature and does not constitute legal, tax, or investment advice. PIM does not make any warranty, express or implied, as to the information’s accuracy or completeness. Prospective investors are encouraged to consult their own professional advisers as to the implications of making an investment in any securities or investment advisory services.
The specific portfolio securities discussed in this presentation are included for illustrative purposes only and were selected based on their ability to help you better understand our investment process. They were selected from securities in one or more of our strategies and were not selected based on performance. They do not represent all of the securities purchased or sold for our client accounts during any particular period, and it should not be assumed that investments in such securities were or will be profitable. PIM is a discretionary investment manager and does not make “recommendations” to buy or sell any securities. There is no assurance that any securities discussed herein remain in our portfolios at the time you receive this presentation or that securities sold have not been repurchased.
For EU Investors Only:
This marketing communication is issued by Pzena Investment Management Europe Limited (“PIM Europe”). PIM Europe (No. C457984) is authorised and regulated by the Central Bank of Ireland as a UCITS management company (pursuant to the European Communities (Undertakings for Collective Investment in Transferable Securities) Regulations, 2011, as amended), with additional authorisation for management of portfolios of investments, in accordance with mandates given by investors on a discretionary, client-by-client basis, where such portfolios include one or more of the investment instruments listed in Section C of the Annex to the MiFID (Markets in Financial Instruments) Regulations 2017 (S.I. No. 375 of 2017), as amended), and investment advice concerning one or more of the instruments listed in Annex I, Section C to Directive 2004/39/EC. PIM Europe is registered in Ireland with the Companies Registration Office (No. 699811), with its registered office at Riverside One, Sir John Rogerson’s Quay, Dublin, 2, Ireland. Past performance does not predict future results. The value of your investment may go down as well as up, and you may not receive upon redemption the full amount of your original investment. The views and statements contained herein are those of Pzena Investment Management and are based on internal research.
For Australia and New Zealand Investors Only:
This document has been prepared and issued by Pzena Investment Management, LLC (ARBN 108 743 415), a limited liability company (“Pzena”). Pzena is regulated by the Securities and Exchange Commission (SEC) under U.S. laws, which differ from Australian laws. Pzena is exempt from the requirement to hold an Australian financial services license in Australia in accordance with ASIC Class Order CO 03/1110 and the transactional relief under ASIC Corporations (Repeal and Transitional) Instrument 2016/396, extended through 31 March 2027 by ASIC Corporations (Foreign Financial Services Providers) Instrument 2025/798. Pzena offers financial services in Australia to ‘wholesale clients’ only pursuant to that exemption. This document is not intended to be distributed or passed on, directly or indirectly, to any other class of persons in Australia.
In New Zealand, any offer is limited to ‘wholesale investors’ within the meaning of clause 3(2) of Schedule 1 of the Financial Markets Conduct Act 2013 (‘FMCA’). This document is not to be treated as an offer, and is not capable of acceptance by, any person in New Zealand who is not a Wholesale Investor.
For South African Investors Only:
Collective Investment Schemes in Securities (CIS) should be considered as medium to long-term investments. The value may go up as well as down and past performance is not necessarily a guide to future performance. CISs are traded at the ruling price and can engage in scrip lending and borrowing. A schedule of fees, charges and maximum commissions is available on request from the Manager. A CIS may be closed to new investors in order for it to be managed more efficiently in accordance with its mandate. There is no guarantee in respect of capital or returns in a portfolio. Performance has been calculated using net NAV to NAV numbers with income reinvested. The performance for each period shown reflects the return for investors who have been fully invested for that period. Individual investor performance may differ as a result of initial fees, the actual investment date, the date of reinvestments and dividend withholding tax. Full performance calculations are available from the manager on request. Annualised performance shows longer term performance rescaled to a 1-year period. Annualised performance is the average return per year over the period. Actual annual figures are available to the investor on request. Highest and lowest returns for any 1 year over the period since inception have been shown. NAV is the net asset value represents the assets of a Fund less its liabilities. Representative Office: Prescient Management Company (RF) (Pty) Ltd is registered and approved under the Collective Investment Schemes Control Act (No.45 of 2002).
© Pzena Investment Management, LLC, 2026. All rights reserved.