The Utility of ESG Scores in the Investment Process
(April 2021)
We examine the relationship between ESG scores and investment performance, and observe that there is a significantly stronger relationship between investment performance and a company’s potential for ESG improvement, as compared to the company’s ESG score. Deep research and extensive engagement can help value investors capitalize on ESG controversy and access this potential source of alpha.
CASE STUDIES
Enel S.p.A., an Italian diversified utility, is navigating the shift to green energy while executing a comprehensive restructuring plan to position itself for success in a changing landscape.
Wilmar International Ltd., a leading Asian agribusiness, is leading environmental and social reform initiatives in a controversial industry.
INTRODUCTION
One of the most intense areas of interest in the investment world today is how practitioners are integrating the consideration of environmental, social, and governance (ESG) issues into their investment processes. Some managers have taken a quantitative approach, incorporating an evolving set of tools to invest in companies with high ESG scores. While others, Pzena included, have focused on the integration of ESG issues into the investment process and working with companies, as active owners, to address those issues.
An integrated approach appreciates the contribution ESG data providers have made to improving the availability and quality of data in the marketplace, but does not use overall ESG scores to make investment decisions. From our perspective, an ESG score is simply one of many inputs to our investment process and by no means the arbiter of investment decisions. That is something that will always be the purview of our bottom-up, fundamentally-driven research team.
Nevertheless, we are committed to furthering our understanding of the utility of ESG scores, particularly as it relates to positions or issues that clients have challenged us on. We therefore embarked on an intellectual exercise, making use of MSCI’s ESG ratings to examine three questions.
- Are stocks with lower ESG scores cheaper?;
- Is there a relationship between ESG scores and investment performance?; and
- Is there a relationship between ESG score improvement and investment performance?
Based on our analysis, initial indications suggest there is not a significant relationship between
a company’s ESG score and future investment performance, however we observed a stronger relationship between ESG score improvement and future investment performance. Given the inherent limitations of data for these analyses, as discussed in Appendix A, these observations, while interesting, should be considered an incremental contribution to furthering the knowledge base in this area, and directional at best.
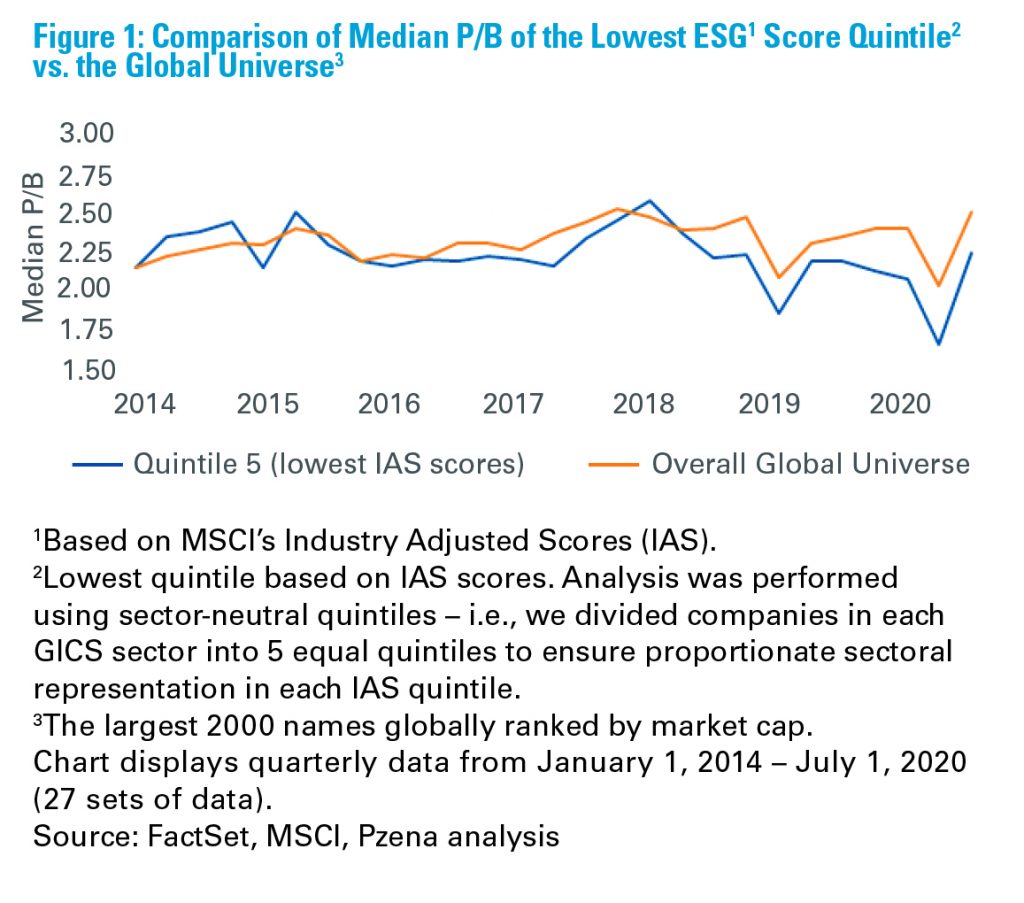
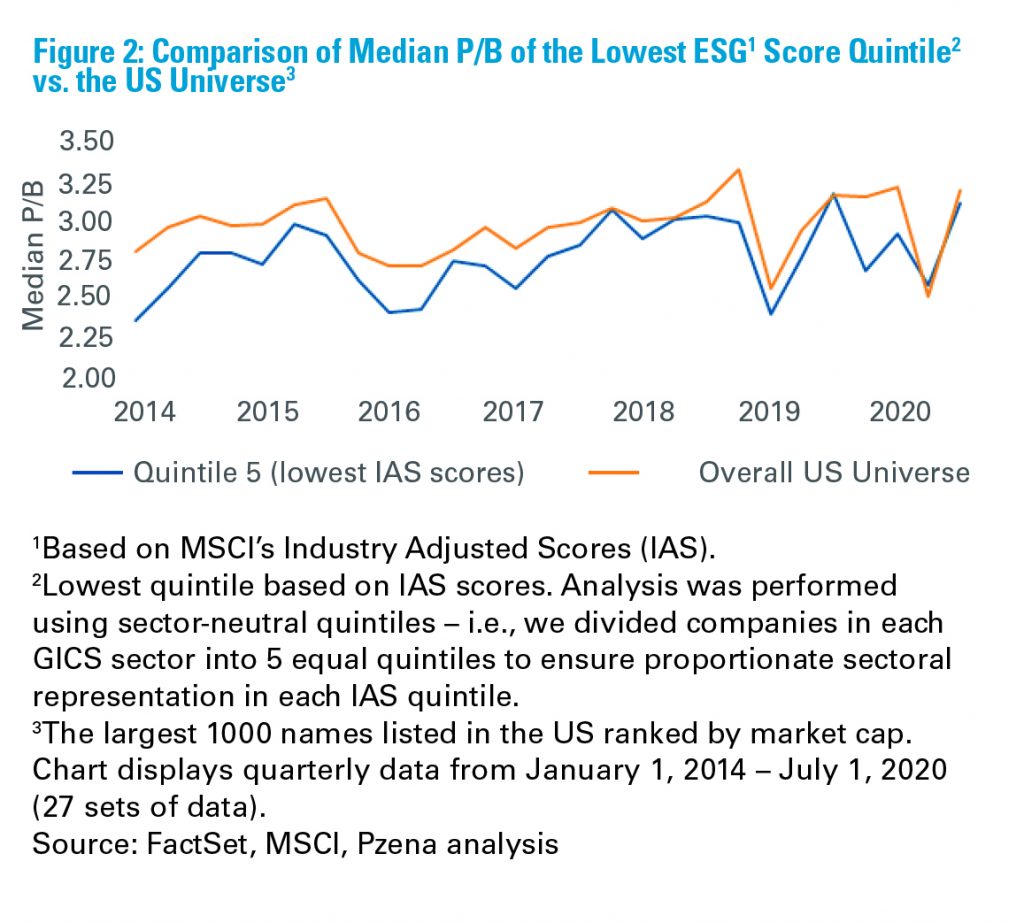
LOWER ESG-RATED STOCKS MAY BE MARGINALLY CHEAPER
We started by testing the hypothesis that lower ESG-rated stocks are cheaper than the overall universe. We used MSCI industry-adjusted ESG scores (IAS) to divide each universe into five quintiles with proportional sectoral representation. As such, each of the quintiles had the same number of companies from each sector to avoid any sectoral bias in ESG scores. As seen in Figures 1 and 2, the lowest ESG score quintile tends to be slightly cheaper than the overall universe. While the gap is not very large, it is noteworthy that this quintile had a lower price-to-book (P/B) valuation than the universe average in 21 of 27 quarters in the Global universe, and 25 of 27 quarters in the US universe. As such, it is probably reasonable to say that, in general, lower ESG-rated stocks appear to be slightly cheaper than the overall universe.
RELATIONSHIP BETWEEN ESG SCORES AND INVESTMENT PERFORMANCE
For this analysis, we focused on the relationship between IAS ESG scores and investment performance, as described in Appendix B, Methodology. We divided the universe into five quintiles, each with the same proportionate sectoral representation based on IAS ESG scores, and we compared the three-year rolling total shareholder returns of each of the quintiles (equally weighted). A strong relationship should, ideally, exhibit three key characteristics. First, there should be a meaningful difference of measured return across quintiles; second, it should follow a monotonic trend across the quintiles (i.e., the highest ESG score improvement quintile outperforms the next improvement quintile, which outperforms the next, and so on), and last, the observed relationship should hold across both the Global and the US data sets.

While both results (Figure 3) show that the lowest ESG scores tend to have weaker performance, the monotonic trend of declining performance with lower ESG scores is only visible in US universe. There is no such relationship in the Global universe where the best return is from the fourth-worst ESG score quintile. Additionally, the return differential for the Global universe quintiles is much less accentuated than the US universe. On the basis of this analysis, the evidence does not demonstrate a strong and sustainable relationship between ESG scores and investment returns.
Also remember that this period coincides with a strong push by asset managers to own higher ESG-rated names, thus bidding them up, while excluding weaker-rated ESG names, leading to lower valuations, thereby creating a performance differential. While it is hard to parse that effect, strong investor preference for higher ESG-rated shares clearly implies that the relationship visible only in the US universe is also likely less strong than it appears, if it exists.
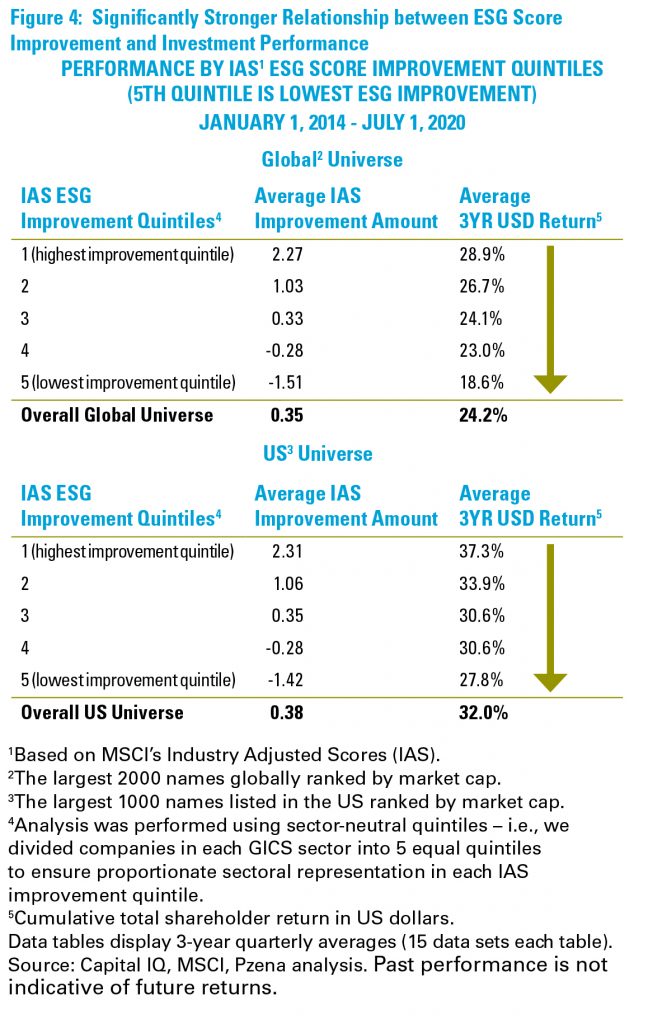
RELATIONSHIP BETWEEN ESG SCORE IMPROVEMENT AND INVESTMENT PERFORMANCE
We further focused on understanding the relationship of ESG score improvement to investment performance. For this analysis, we divided the universe into five quintiles, each with the same proportionate sectoral representation based on improvement in IAS ESG scores, and compared the three-year rolling total shareholder returns of each of the quintiles (equally weighted). As seen in Figure 4 on the next page, there appears to be a significantly stronger relationship between ESG score improvement and total shareholder returns. On average, stocks with improved ESG scores tend to outperform stocks with lower improvement in their ESG scores. This relationship is equally strong across both universes, and is monotonic.
INVESTMENT IMPLICATIONS
Given the study’s limitations, it is unwise to draw strong conclusions, but it may be plausible to make certain inferences. This analysis elucidates that ESG score improvement has potentially a much stronger relationship to investment performance than a pure ESG score. That also makes sense as most ESG ratings are backward looking and miss the direction of change. That means that weak ESG scores themselves are not a negative. In fact, a weak ESG score could be a reason why the stock is cheap; and it may be a great investment opportunity if the company has solid ESG improvement potential, irrespective of its current rating. Investing in those stocks is a win-win because the community is better served when a company improves its ESG prudence, and investors benefit by way of strong shareholder returns.
Clearly not every company will improve its ESG performance. Deep company-specific investment research is critical to identifying the stocks that can, followed by extensive and continuous engagement with the company to help management in their transition to better ESG performance. Shareholder engagement helps investors determine which transition plans are sound (and which aren’t). More importantly, it gives investors a voice to ensure that companies allocate capital efficiently to projects that make sense. For example, with the transition to a lower carbon economy underway, starving economically critical businesses of capital because they are more carbon intensive will only make the monumental task of the transition that much harder. Walking away, i.e., divesting from these companies, achieves nothing and may drive them to other less-accountable sources of capital than the public markets. Through engagement, market participants can select which energy players are putting capital to work more effectively, and allocate investments accordingly.
ESG AND VALUE INVESTING
A widely-held belief is that value stocks are weak on ESG and weak ESG stocks tend to underperform, implying that value investing and ESG prudence are in conflict, even mutually exclusive. This study opens up this view for debate, suggesting that value investors can capitalize on valuation dislocations due to ESG considerations by understanding the long-term impact of company-specific ESG improvement actions. A combination of deep research and extensive engagement are necessary for investors to access this potential source of alpha generation.
In that respect, the company’s ESG score likely matters less than the selection and monitoring of investments based on improvement potential. Our focus, therefore, is not on the absolute score, or even good versus bad ESG scores, but on whether we believe the company can recover its normalized earnings power over time. The combination of deep research and extensive engagement can help value investors like us capitalize on ESG controversy to achieve the objective of generating superior investment returns.
We highlight this approach of engagement-led ESG improvement through the following two case studies.
Enel S.p.A. – A Utility in Transition
The story of Enel, a diversified utility based in Rome, Italy, is one of a company forced to recover from self-inflicted wounds, while navigating an evolving sector disrupted by the widespread adoption of green energy. These two headwinds created a classic value opportunity where the quality of the company’s core business was obscured by poor results and fears of disruption. New management cut costs, implemented a culture of capital discipline, simplified the business, and invested prudently to better position the company for the changing landscape, creating the potential for a robust earnings recovery and a re-rating of the stock. Our conviction in Enel’s turnaround was largely predicated on improvements in management’s approach to environmental risks and corporate governance practices.
In terms of the environment, Enel had been shifting its focus toward businesses that stood to benefit in the new utility landscape: electricity distribution, renewables generation, and broader digitalization, such as smart meters. This came with a commitment to allocate 95% of its capital expenditure over multiple years to focus on these initiatives. Today, Enel is the largest non-government-owned renewable operator in the world, with over 49 GW of installed renewable energy capacity. Enel is continuing to expand its renewable offering, targeting 60 GW by 2022; at which point it will generate almost 60% of its total production from renewables. In tandem, Enel is phasing out coal generation by 2025-2027 (recently accelerated from 2030) and will completely decarbonize by 2050. Enel should also benefit from increased network investments, a necessary part of this energy transition that should enable Enel to earn solid regulated returns due to governments’ desire for an upgraded, more efficient grid.
Governance improvements started with the appointment of a new CEO in 2014. He was leading Enel’s growing green power division and was well suited to help the company navigate the disruption posed by renewables. He proceeded to transform Enel in numerous ways: increasing operating efficiency; streamlining the corporate structure; focusing capital spending on stable businesses; shifting away from traditional generation and commodity exposure; and improving capital allocation. He discarded major transformative acquisitions, instead focusing on select bolt-on deals, reduced debt, and invested in the business to address energy transition risk. Enel also increased its focus on returning capital to shareholders. It has increased its dividend at a double-digit rate since 2013 and committed to a 70% payout ratio going forward.
Through these changes, Enel has transformed from an industry laggard for environmental and governance risks to an efficiently run industry leader with a stable business mix well-positioned for future growth. The company’s turnaround (from 2016 to 2019) broadly mirrors the performance period we examined. Over this time Enel’s stock experienced a 77% 3-year return, and the company was upgraded by MSCI from an A to AA ESG rating.
Wilmar International Ltd. – Affecting Change in a Controversial Industry
Wilmar is a leading Asian agribusiness with operations in palm oil refining, oilseed crushing, and manufacturing of consumer products. The palm oil industry is notoriously controversial, garnering negative media attention for its role in rainforest deforestation and inadequate protection of labor rights in the supply chain. Driven largely by consumer pressure, large buyers of palm oil – specifically consumer goods companies such as Unilever and Nestle – have increasingly pushed their suppliers to shore-up a sustainable palm oil supply chain. Wilmar is a classic example of where business success became inherently tied to improvement in ESG practices.
We identified several ESG issues around deforestation for palm plantations, child labor and human rights in the palm supply chain, supplier management, and sustainable palm oil production. We engaged with the senior management and the chief sustainability officer extensively to assess their commitment to addressing these sustainability and labor practice issues. As shareholders in Wilmar, we focused our engagement to fully evaluate the investment risks, as well as to ensure that the company understood the gravity of these issues and to emphasize management actions and investments to proactively address these issues.
Wilmar instituted a zero-tolerance ‘no deforestation, no peat, no exploitation’ policy in 2013, but most notable is the work Wilmar undertook to significantly enhance its supply chain compliance and monitoring efforts. This culminated in the signing of a joint statement with consumer goods companies in December 2018 that established a clear zero-tolerance policy for all Wilmar suppliers – with any transgression resulting in immediate suspension of the supplier until a remediation plan is in effect. Wilmar was the first major player in the market to make this commitment to zero-tolerance, which undoubtedly positioned it favorably among its major customers.
In 2016, Amnesty International published an explosive report alleging widespread exploitative labor practices (including child labor) at the farms Wilmar purchases its raw material from, as well as at their own Wilmar-owned plantations. Amnesty International made a calculated move to highlight Wilmar because Wilmar’s scale allows it to effect change throughout the value chain, while trying to influence individual small farmers is less efficient. While child labor was not knowingly occurring at any Wilmar plantation, and many of the allegations were unfounded, negative reputational repercussions lingered for some time in the market. The claims in the 2016 report notwithstanding, Wilmar has made substantial improvements in its identification and management of labor rights issues. These efforts include education initiatives implemented at the planation level and publication of a human rights and women’s charter framework.
In our engagements, we found the company and its founders to be focused on franchise longevity and very willing to proactively address these business risks. Wilmar has made steady progress which has accelerated over the last five years, achieving significant progress in both ESG ratings and profitability. The timeframe of these improvements broadly mirrors the performance period we examined (2015 to 2018) where Wilmar experienced a 41% total shareholder return and was simultaneously upgraded by MSCI from a BB to BBB ESG rating. Wilmar’s sustainability efforts have improved enough such that company was listed for the first time on the well-respected Dow Jones Sustainability Index in 2020 and scored above the 90th percentile for indicators related to raw material sourcing, human rights, and labor practices.
APPENDICES
Appendix A: Study Limitations
There are several limitations of this analysis. Most importantly, the time period is too short to measure long term trends with meaningful significance. Additionally, this period is during one of the worst divergences in growth and value returns, potentially creating distortions in performance analysis. The analysis relies on MSCI’s ESG ratings; while having continuously improved the rigor and coverage of its ratings, MSCI was still in the evolutionary phase in terms of depth and sophistication of the scoring mechanism. It is, however, the most comprehensive data set we have available for the duration of the study. Also, we used rolling three-year performance periods and, given the duration of our analysis,
it weighs interim periods higher in the eventual calculations. Lastly, as with all correlations, a relationship between ESG factors and performance as demonstrated in the analysis does not imply causation in any way.
Appendix B: Methodology
The analysis is based on MSCI company ESG scores from January 1, 2014 – July 1, 2020, taken at the beginning of every quarter. We used MSCI’s Industry Adjusted Scores (IAS) instead of absolute scores. IAS normalize the scores across industries thereby helping us avoid data bias as some industries have inherently lower scores versus others. To further eliminate any sectoral skews, all the analysis was performed on sector-neutral quintiles – i.e., we divided companies in each GICS sector into 5 equal quintiles to ensure proportionate sectoral representation in each quintile. That ensured that within each quintile, it has the same mix of number of names from each sector same as that of the universe.
We performed our analysis on two universes – Global and US. Our Global universe included the top 2000 names globally by market cap and our US universe included the top 1000 names listed in US by market cap. We eliminated about 20% of the names in each of the universes due to lack of data.
For each of the names in the universe, we collected MSCI’s Industry Adjusted Scores (IAS) at the beginning of each quarter from January 1, 2014 to July 1, 2020. We used CapitalIQ to calculate total shareholder returns for each of the corresponding periods for our stock performance analysis.
For each analysis, we used a simple average of total shareholder returns of all the companies in the respective quintiles for all the 3-year periods for the time frame of our study, January 1, 2014 – July 1, 2020. This implied 15 3-year time periods starting from January 1, 2014 to January 1, 2017 and last one being from July 1, 2017 to July 1, 2020. As we used a simple average, it effectively meant all the performance calculations are based on equal-weighting of the stocks in each quintile.
DISCLOSURES
These materials are intended solely for informational purposes. The views expressed reflect the current views of Pzena Investment Management (“PIM”) as of the date hereof and are subject to change. PIM is a registered investment adviser registered with the United States Securities and Exchange Commission. PIM does not undertake to advise you of any changes in the views expressed herein. There is no guarantee that any projection, forecast, or opinion in this material will be realized. Past performance is not indicative of future results. All investments involve risk, including risk of total loss.
This document does not constitute a current or past recommendation, an offer, or solicitation of an offer to purchase any securities or provide investment advisory services and should not be construed as such. The information contained herein is general in nature and does not constitute legal, tax, or investment advice. PIM does not make any warranty, express or implied, as to the information’s accuracy or completeness. Prospective investors are encouraged to consult their own professional advisers as to the implications of making an investment in any securities or investment advisory services.
The specific portfolio securities discussed in this presentation are included for illustrative purposes only and were selected based on their ability to help you better understand our investment process. They were selected from securities in one or more of our strategies and were not selected based on performance. They do not represent all of the securities purchased or sold for our client accounts during any particular period, and it should not be assumed that investments in such securities were or will be profitable. PIM is a discretionary investment manager and does not make “recommendations” to buy or sell any securities. There is no assurance that any securities discussed herein remain in our portfolios at the time you receive this presentation or that securities sold have not been repurchased.
For U.K. Investors Only:
This financial promotion is issued by Pzena Investment Management, Ltd. (“PIM UK”). PIM UK is a limited company registered in England and Wales with registered number 09380422, and its registered office is at 34-37 Liverpool Street, London EC2M 7PP, United Kingdom. PIM UK is an appointed representative of Mirabella Advisers LLP, which is authorised and regulated by the Financial Conduct Authority. The Pzena documents are only made available to professional clients and eligible counterparties as defined by the FCA. Past performance is not indicative of future results. The value of your investment may go down as well as up, and you may not receive upon redemption the full amount of your original investment. The views and statements contained herein are those of Pzena Investment Management and are based on internal research.
For Australia and New Zealand Investors Only:
This document has been prepared and issued by Pzena Investment Management, LLC (ARBN 108 743 415), a limited liability company (“Pzena”). Pzena is regulated by the Securities and Exchange Commission (SEC) under U.S. laws, which differ from Australian laws. Pzena is exempt from the requirement to hold an Australian financial services license in Australia in accordance with ASIC Corporations (Repeal and Transitional) Instrument 2016/396. Pzena offers financial services in Australia to ‘wholesale clients’ only pursuant to that exemption. This document is not intended to be distributed or passed on, directly or indirectly, to any other class of persons in Australia.
In New Zealand, any offer is limited to ‘wholesale investors’ within the meaning of clause 3(2) of Schedule 1 of the Financial Markets Conduct Act 2013 (‘FMCA’). This document is not to be treated as an offer, and is not capable of acceptance by, any person in New Zealand who is not a Wholesale Investor.
For Jersey Investors Only:
Consent under the Control of Borrowing (Jersey) Order 1958 (the “COBO” Order) has not been obtained for the circulation of this document. Accordingly, the offer that is the subject of this document may only be made in Jersey where the offer is valid in the United Kingdom or Guernsey and is circulated in Jersey only to persons similar to those to whom, and in a manner similar to that in which, it is for the time being circulated in the United Kingdom, or Guernsey, as the case may be. The directors may, but are not obliged to, apply for such consent in the future. The services and/or products discussed herein are only suitable for sophisticated investors who understand the risks involved. Neither Pzena Investment Management, Ltd. nor Pzena Investment Management, LLC nor the activities of any functionary with regard to either Pzena Investment Management, Ltd. or Pzena Investment Management, LLC are subject to the provisions of the Financial Services (Jersey) Law 1998.
For South African Investors Only:
Pzena Investment Management, LLC is an authorised financial services provider licensed by the South African Financial Sector Conduct Authority (licence nr: 49029).
© Pzena Investment Management, LLC, 2021. All rights reserved.