The Current Opportunity In Small Caps Globally
First Quarter 2023 Commentary
Small-cap stocks globally are attractively valued and have historically generated better returns than large-caps. They offer a broader, more diverse, less correlated, and undiscovered universe of opportunities.
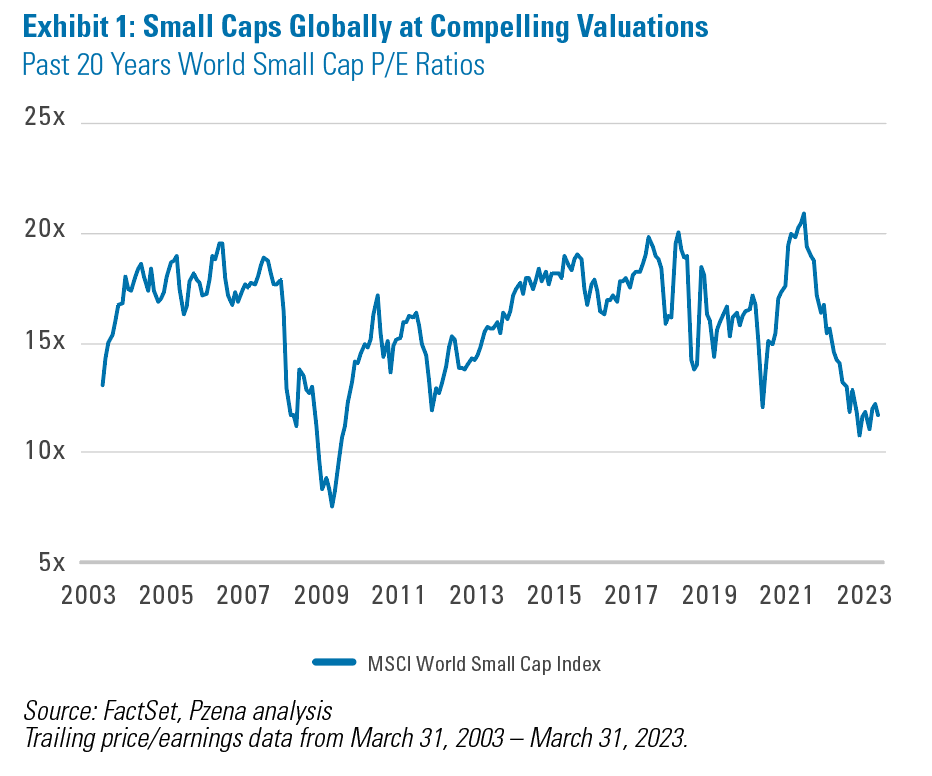
Today is a particularly attractive entry point for small cap stocks around the world. Despite rising over 80% since the depths of COVID, the MSCI World Small Cap Index is at a near 20-year low current PE of 11.9x (Exhibit 1). Additionally, global small cap stocks are also trading at near generational lows relative to global large cap stocks.1
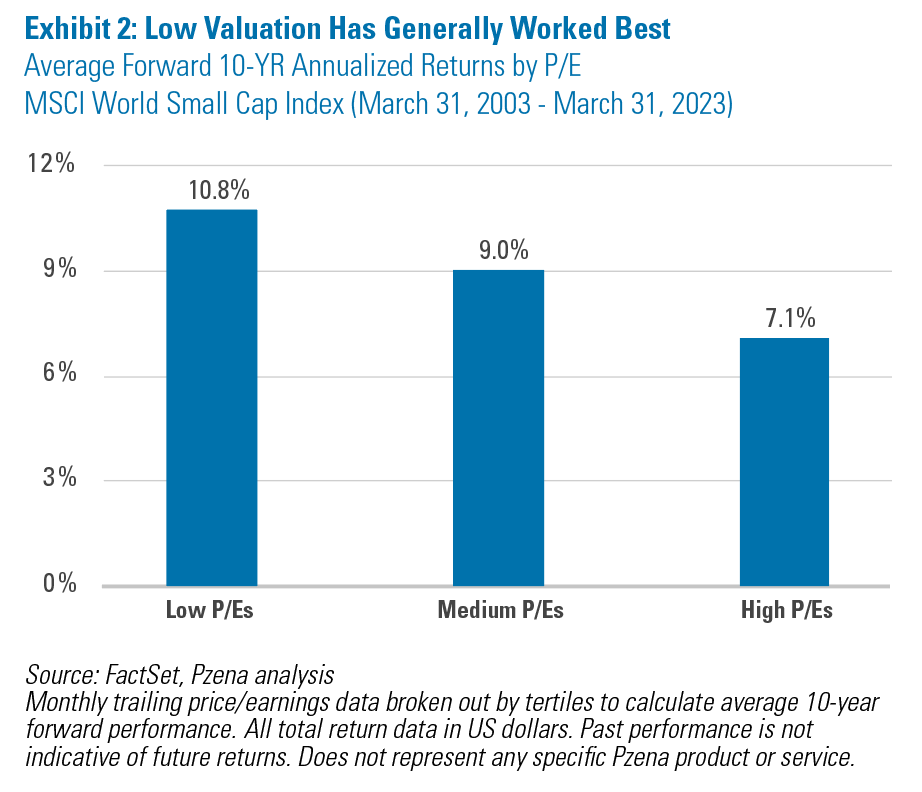
Intuitively periods of low valuation should be good starting points, and not surprisingly, buying small cap stocks when they trade at low PEs has generated the greatest forward returns (Exhibit 2).
It is an especially attractive time for global small cap value, as valuation spreads2 are wide, at the 93rd percentile over the past 50 years, despite contracting over the past fifteen months. Historically, wider spreads have been a particularly good entry point for value portfolios.
WHY SMALL CAP
Small cap investing is a close cousin of value investing. While small cap investors search among undiscovered stocks, value investors search among underappreciated stocks. As such, it should not be surprising that pairing small cap with value investing has generated superior historical returns globally. Small cap investing is especially attractive for active investors because it is a less crowded corner of the equity universe.
THE SMALL CAP ADVANTAGE
Small cap stocks, especially those outside the US, provide access to a wide array of currencies, economies, regulatory regimes, languages, and market cycles. Understanding these nuances across different geographical areas can present lucrative opportunities; however, specific skills and judgment are required. Historically, although small caps have exhibited higher short-term volatility than their large cap counterparts, they have generated better returns while offering a broader, more diverse, less correlated, and undiscovered universe of stocks.
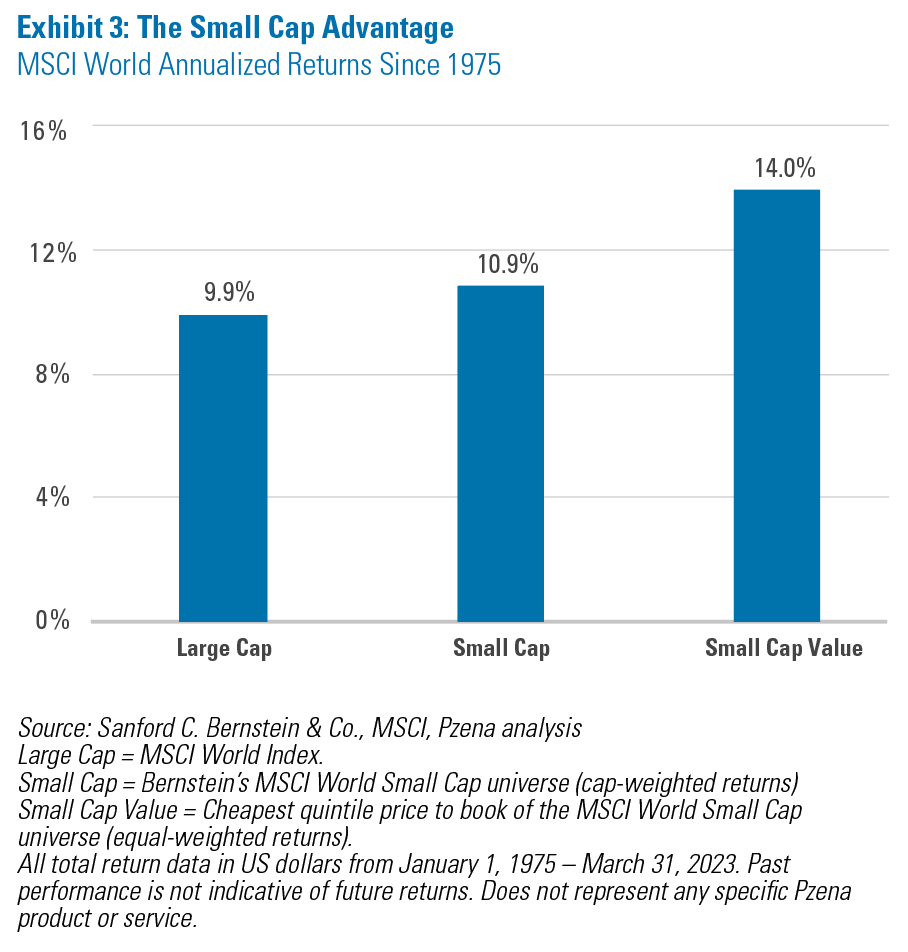
Performance: Globally, small cap stocks have beaten their large cap equivalents by more than 100 basis points per year since 1975, and small cap value stocks have beaten the style neutral small cap index by more than 300 basis points per year (Exhibit 3). This phenomenon is equally powerful across US and non-US markets, which shouldn’t be too surprising to investors, as the outperformance of both value and small cap stocks has been well-documented in academic literature (Fama & French 1993, extended in 1998 to include international markets).
Undiscovered: Part of the explanation for the discernible outperformance can be chalked up to a lack of transparency. Valuation distortions can be more pronounced in smaller companies, which attract less attention from brokerage/equity research firms than large companies. 28.0% of global small cap stocks are followed by three or fewer analysts compared with just 2.4% of global large cap stocks.3 Thin analyst coverage usually manifests in more frequent and measurable short-term pricing deviations, as traders naturally have less reliable and readily available information on which to base investment decisions.
This lack of analyst coverage is, in part, due to the small cap universe containing three times as many stocks as the universe of mid/large cap. Therefore, it takes a dedicated research team with a disciplined process to canvas the globe and sift through the broad and diverse universe to find truly outstanding opportunities.
Less Correlated: While large cap indices are highly correlated, the breadth and diversity of global small cap stocks offer the opportunity to build more differentiated portfolios. This is particularly true for global small cap value stocks, which are far less correlated with their large cap cousins and therefore, offer a higher level of overall portfolio diversification. The average rolling five-year correlations of monthly returns between the MSCI World Small Cap Value Index and the MSCI World and Russell 1000® indices are 0.79 and 0.56, respectively.4
ACTIVE ADVANTAGE IN SMALL CAP
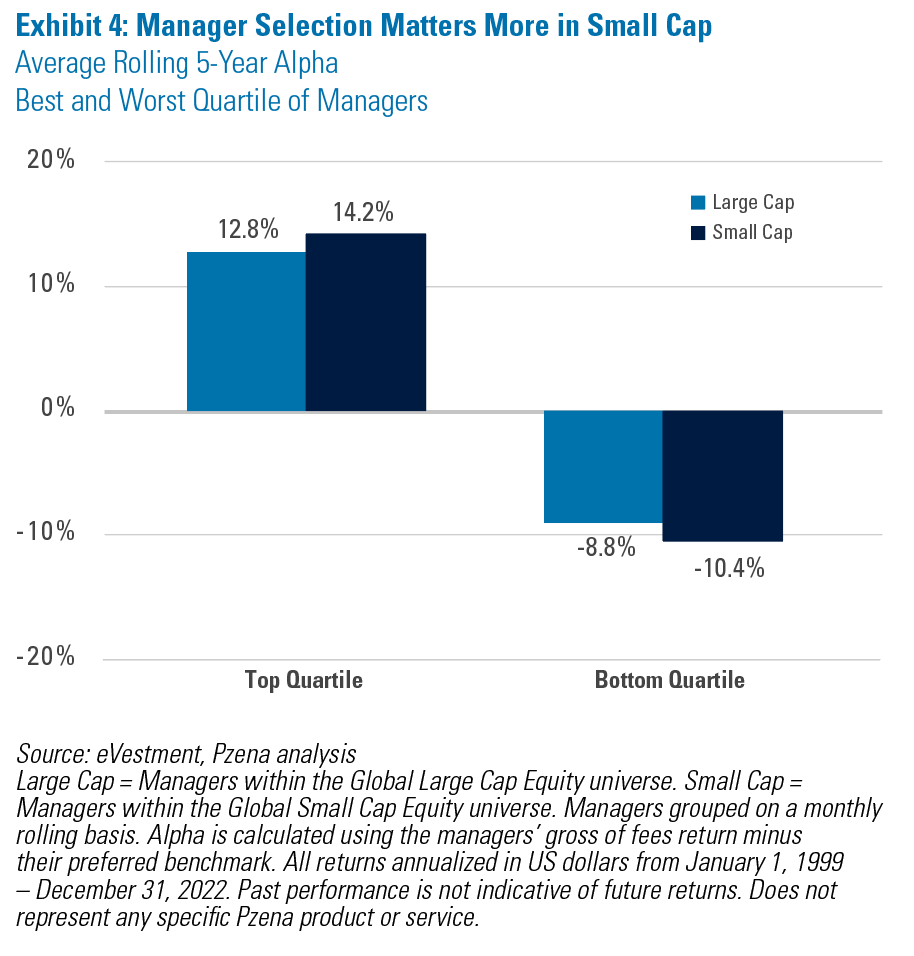
With limited capacity as a gating factor to asset gatherers, small cap is a less crowded space, with active large cap managers outnumbering small cap managers by almost eight to one. Manager selection is crucial, as the excess return of the best quartile of small cap managers exceeds large cap managers by 140 basis points on average over rolling five-year periods across the past 20 years. Among the worst performing managers, small cap underperformers trail large cap by 160 basis points on average (Exhibit 4), again highlighting the importance of manager selection and the opportunity for active management.
We believe the reason for this disparity goes back to the underfollowed nature of small cap stocks. With less Wall Street analyst coverage, earnings estimates and annual returns are more dispersed. The dispersion of broker earnings estimates5 is 17% for MSCI World Index compared with 29% for MSCI World Small Cap Index, while the stock price dispersion is 30% for MSCI World Index and 47% for MSCI World Small Cap Index.6 This greater dispersion creates opportunities for active managers to outperform through fundamental research.
The earnings and return dispersion are partially driven by money losing businesses. With the percentage of loss making small caps near a 20-year peak at 43% for US small cap and 23% for global small cap,7 the ability to sift through these businesses to find companies merely facing temporary issues, versus fundamentally bad businesses, is crucial to outperforming. Many people perceive small cap companies to be subscale competitors to larger peers, but in reality, many are leaders in niche businesses. It takes deep fundamental research to differentiate between good businesses and subscale competitors lacking competitive advantage.
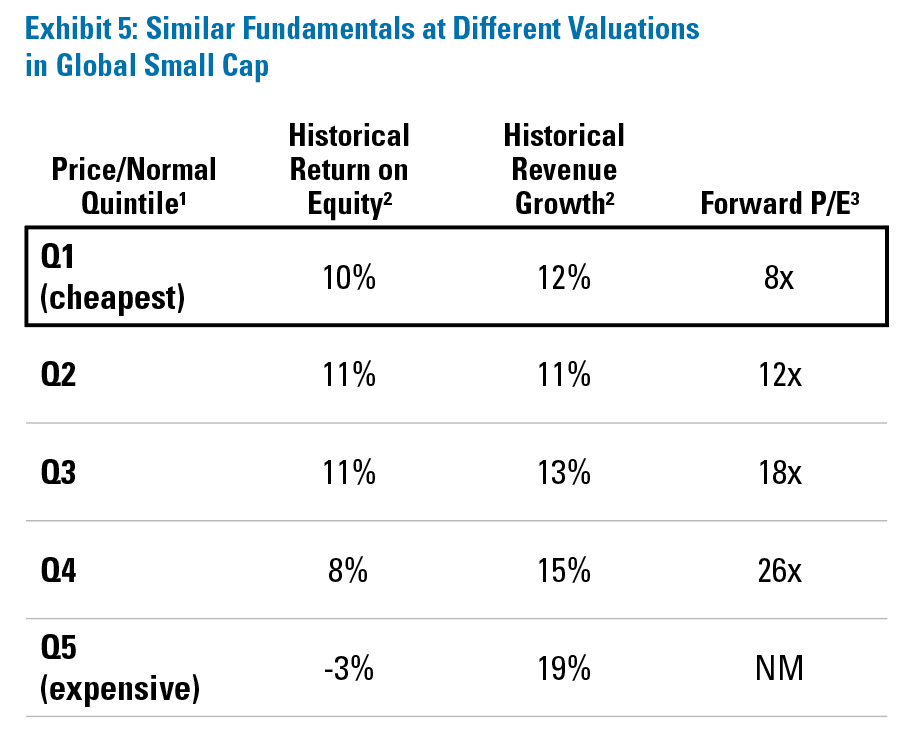
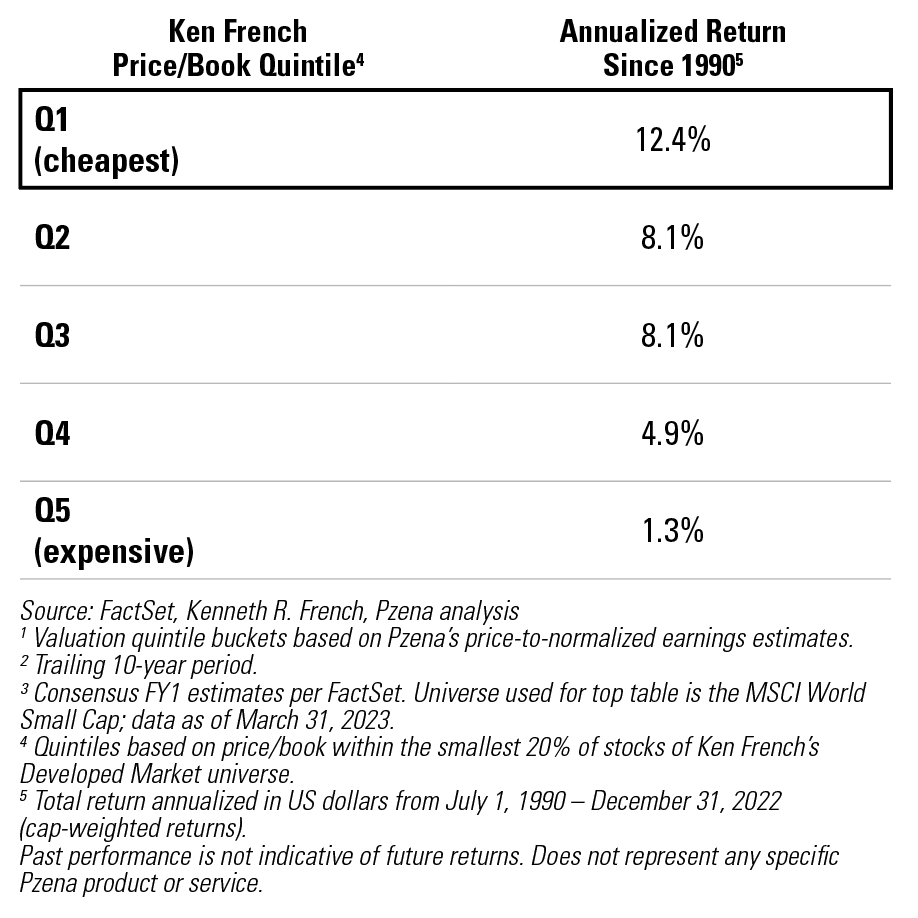
Equally crucial to outperforming is maintaining the discipline to invest in good businesses trading at steep discounts to their fundamental values, while avoiding overpaying for fundamentally bad businesses in the hopes of finding the rare small cap that someday may become the next Apple. The current fundamentals of the cheapest quintile of small cap stocks are significantly better than the so called “glamour stocks” or most expensive stocks, and have also performed significantly better historically (Exhibit 5).
CONCLUSION
Global small cap stocks are a relatively underappreciated and underexploited corner of the global equity market. Given their historical record of delivering superior returns and trading near 20-year lows, we believe they warrant further attention from investors seeking a more diversified and distinctive asset class, particularly given today’s valuation opportunity.
Footnotes
1MSCI World Small Cap Index vs MSCI World Index current P/E ratio. Source: FactSet.
2Dispersion between cheapest and most expensive quintiles based on price to book within the MSCI World Small Cap universe. Source: Sanford C. Bernstein & Co., Pzena analysis
3MSCI World Small Cap Index and MSCI World Index. Source: FactSet, Pzena analysis
4Data from January 1, 2001 – March 31, 2023. Source: FactSet, Pzena analysis
5The average standard deviation of all broker FY1 EPS estimates for each stock in the index as of March 31, 2023. Source: FactSet, Pzena analysis
6The standard deviation of returns for all holdings in the index; calculated annually. Data from December 31, 2003 – December 31, 2022. Source: FactSet, Pzena analysis
7Based on latest reported fiscal EPS of each stock in the Russell 2000 Index and MSCI World Small Cap Index. Source: FactSet, Pzena analysis
FURTHER INFORMATION
These materials are intended solely for informational purposes. The views expressed reflect the current views of Pzena Investment Management (“PIM”) as of the date hereof and are subject to change. PIM is a registered investment adviser registered with the United States Securities and Exchange Commission. PIM does not undertake to advise you of any changes in the views expressed herein. There is no guarantee that any projection, forecast, or opinion in this material will be realized. Past performance is not indicative of future results.
All investments involve risk, including loss of principal. Investments may be in a variety of currencies and therefore changes in rates of exchange between currencies may cause the value of investments to decrease or increase. The price of equity securities may rise or fall because of economic or political changes or changes in a company’s financial condition, sometimes rapidly or unpredictably. Investments in foreign securities involve political, economic and currency risks, greater volatility and differences in accounting methods. These risks are greater for investments in Emerging Markets. Investments in small-cap or mid-cap companies involve additional risks such as limited liquidity and greater volatility than larger companies. PIM’s strategies emphasize a “value” style of investing, which targets undervalued companies with characteristics for improved valuations. This style of investing is subject to the risk that the valuations never improve or that returns on “value” securities may not move in tandem with the returns on other styles of investing or the stock market in general.
This document does not constitute a current or past recommendation, an offer, or solicitation of an offer to purchase any securities or provide investment advisory services and should not be construed as such. The information contained herein is general in nature and does not constitute legal, tax, or investment advice. PIM does not make any warranty, express or implied, as to the information’s accuracy or completeness. Prospective investors are encouraged to consult their own professional advisers as to the implications of making an investment in any securities or investment advisory services.
The MSCI information may only be used for internal use, may not be reproduced or redisseminated in any form and may not be used as a basis for or a component of any financial instruments or products or indices. None of the MSCI information is intended to constitute investment advice or a recommendation to make (or refrain from making) any kind of investment decision and may not be relied on as such. Historical data and analysis should not be taken as an indication or guarantee of any future performance analysis, forecast or prediction. The MSCI information is provided on an “as is” basis and the user of this information assumes the entire risk of any use made of this information. MSCI, each of its affiliates and each other person involved in or related to compiling, computing or creating any MSCI information (collectively, the MSCI Parties) expressly disclaims all warranties (including, without limitation, any warranties of originality, accuracy, completeness, timeliness, non-infringement, merchantability and fitness for a particular purpose) with respect to this information. Without limiting any of the foregoing, in no event shall any MSCI party have any liability for any direct, indirect, special, incidental, punitive, consequential (including, without limitation, lost profits) or any other damages.
For U.K. Investors Only:
This marketing communication is issued by Pzena Investment Management, Ltd. (“PIM UK”). PIM UK is a limited company registered in England and Wales with registered number 09380422, and its registered office is at 34-37 Liverpool Street, London EC2M 7PP, United Kingdom. PIM UK is an appointed representative of Mirabella Advisers LLP, which is authorised and regulated by the Financial Conduct Authority. The Pzena documents are only made available to professional clients and eligible counterparties as defined by the FCA. Past performance is not indicative of future results. The value of your investment may go down as well as up, and you may not receive upon redemption the full amount of your original investment. The views and statements contained herein are those of Pzena Investment Management and are based on internal research.
For EU Investors Only:
This marketing communication is issued by Pzena Investment Management Europe Limited (“PIM Europe”). PIM Europe (No. C457984) is authorised and regulated by the Central Bank of Ireland as a UCITS management company (pursuant to the European Communities (Undertakings for Collective Investment in Transferable Securities) Regulations, 2011, as amended). PIM Europe is registered in Ireland with the Companies Registration Office (No. 699811), with its registered office at Riverside One, Sir John Rogerson’s Quay, Dublin, 2, Ireland. Past performance is not indicative of future results. The value of your investment may go down as well as up, and you may not receive upon redemption the full amount of your original investment. The views and statements contained herein are those of Pzena Investment Management and are based on internal research.
For Australia and New Zealand Investors Only:
This document has been prepared and issued by Pzena Investment Management, LLC (ARBN 108 743 415), a limited liability company (“Pzena”). Pzena is regulated by the Securities and Exchange Commission (SEC) under U.S. laws, which differ from Australian laws. Pzena is exempt from the requirement to hold an Australian financial services license in Australia in accordance with ASIC Corporations (Repeal and Transitional) Instrument 2016/396. Pzena offers financial services in Australia to ‘wholesale clients’ only pursuant to that exemption. This document is not intended to be distributed or passed on, directly or indirectly, to any other class of persons in Australia.
In New Zealand, any offer is limited to ‘wholesale investors’ within the meaning of clause 3(2) of Schedule 1 of the Financial Markets Conduct Act 2013 (‘FMCA’). This document is not to be treated as an offer, and is not capable of acceptance by, any person in New Zealand who is not a Wholesale Investor.
For Jersey Investors Only:
Consent under the Control of Borrowing (Jersey) Order 1958 (the “COBO” Order) has not been obtained for the circulation of this document. Accordingly, the offer that is the subject of this document may only be made in Jersey where the offer is valid in the United Kingdom or Guernsey and is circulated in Jersey only to persons similar to those to whom, and in a manner similar to that in which, it is for the time being circulated in the United Kingdom, or Guernsey, as the case may be. The directors may, but are not obliged to, apply for such consent in the future. The services and/or products discussed herein are only suitable for sophisticated investors who understand the risks involved. Neither Pzena Investment Management, Ltd. nor Pzena Investment Management, LLC nor the activities of any functionary with regard to either Pzena Investment Management, Ltd. or Pzena Investment Management, LLC are subject to the provisions of the Financial Services (Jersey) Law 1998.
For South African Investors Only:
Pzena Investment Management, LLC is an authorised financial services provider licensed by the South African Financial Sector Conduct Authority (licence nr: 49029).
© Pzena Investment Management, LLC, 2023. All rights reserved.