Maintaining Focus: Value’s Strong Fundamentals
Third Quarter 2021 Commentary
The opportunity in value stocks remains compelling. Long-term investors should ignore the noise and focus on cheap valuations, strong operating metrics, and the solid real returns value stocks offer.
FOCUS ON THE VALUE OPPORTUNITY
We have argued for some time that the opportunity in value stocks is compelling: valuations are cheap, operating metrics are strong, and they offer high single-digit to low double-digit real returns depending on geography. Despite value’s fantastic fundamentals, it has seen uneven performance among the ebbs and flows of macroeconomic uncertainties. Given the severe downturn in economic activity that occurred at the outset of the pandemic, it should not be surprising that economic recovery is coming in fits and starts. We believe long-term investors should be rewarded over a long and enduring pro-value cycle if they look past these temporary setbacks, ultimately benefitting from the fundamentals that remain in place.
POSITIVE REAL EARNINGS YIELD FOR VALUE
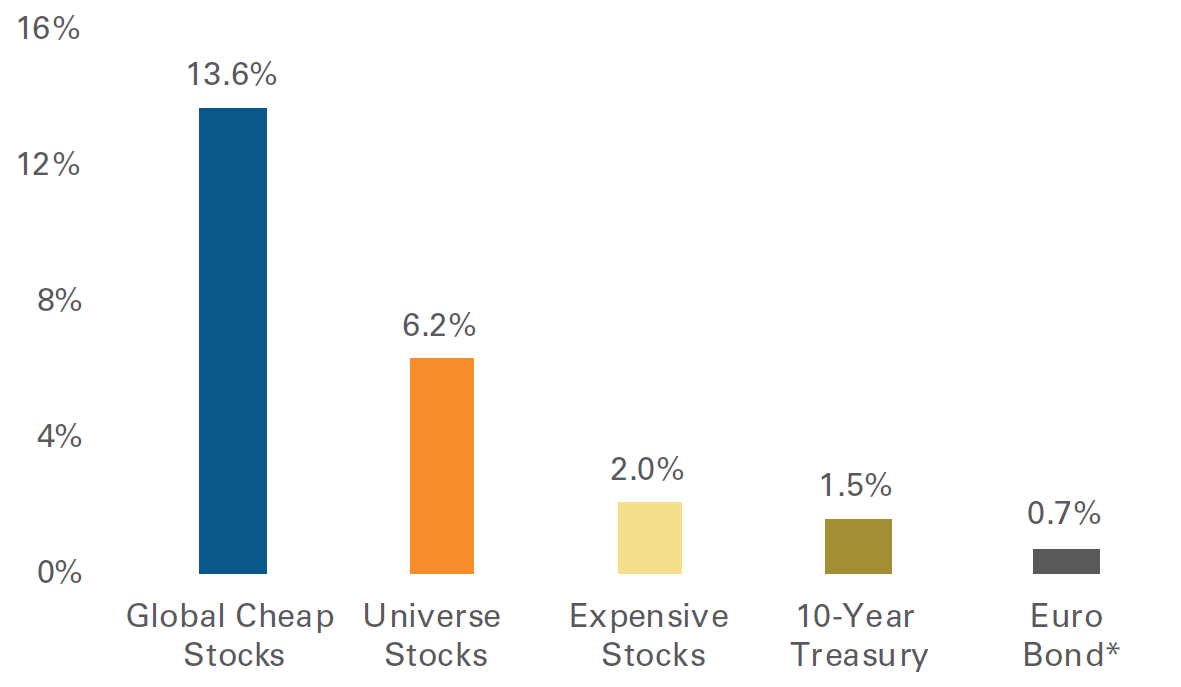
Value stocks are one of the few investment opportunities offering positive projected real returns, where the earnings yield is well in excess of expected inflation. The earnings yield of cheap stocks, or the price one pays for normalized earnings, ranges from low double digits to mid-teens across the world. Alternatively, investors have bid up the price on global fixed income products to the point where there is little yield to be earned on “safe” assets (Figure 1).
Figure 1 – Cheap Stocks Currently Have Superior Earnings Yields
Source: FactSet, Pzena analysis
Cheap/Expensive earnings yield are based on the median stock within the cheapest and most expensive quintile based on price-to-normal earnings. The quintiles are measured on an equally weighted basis within the ~2,000 largest global stock universe. Price-to-normal earnings are Pzena’s estimates. Universe stocks is the earnings yield of the median stock within the entire universe. *Yield of the Bloomberg Barclays Euro Aggregate 10+Y Index. The index is a benchmark that measures the Treasury component of the Euro-Aggregate and consists of fixed-rate, investment grade public obligations of the sovereign countries in the eurozone; the index currently contains euro-denominated issues from 17 countries. Data as of September 30, 2021.
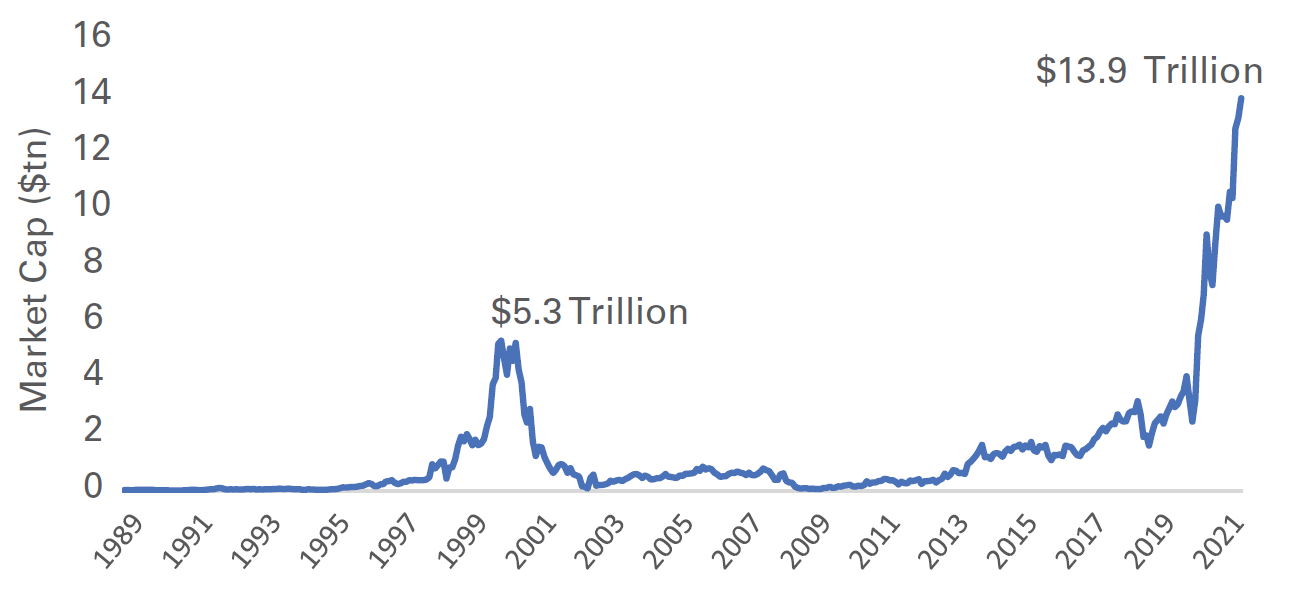
Meanwhile, expensive stocks have continued to get more expensive. Today the market cap of stocks that are trading at greater than 10x sales is more than twice what it was in the internet bubble and three times the market cap of the cheapest quintile (Figure 2).
Figure 2 – Total Market Cap of Stocks with Price-to-Sales Greater than 10x
Source: Kailash Concepts
Universe is the Russell 3000 Index. Data as of August 31, 2021.
However, history has not been kind to stocks that trade over 10x sales. Over the last 32 years, stocks trading at greater than 10x sales have generated a compound annual return of -0.3%, versus the broader US market of about 11.0%.
VALUE CYCLES ARE BUMPY
Contributing to the compelling valuation disparity, June 2021 was one of the worst months for value, as the Russell 1000 Value Index trailed the Russell 1000 Growth Index by 7.4 percentage points (one of only 17 months over the past 42 years in which value trailed growth by more than 5 percentage points). And as value trailed again in July and August, investors wondered if the value rally was over.
The anti-value period in markets that has lasted for much of the last decade is a potent reminder of the cyclical nature of value. However, it is such periods, during which the majority of investors give up on cheap stocks, that create the conditions for the strategy to work over the long-term.
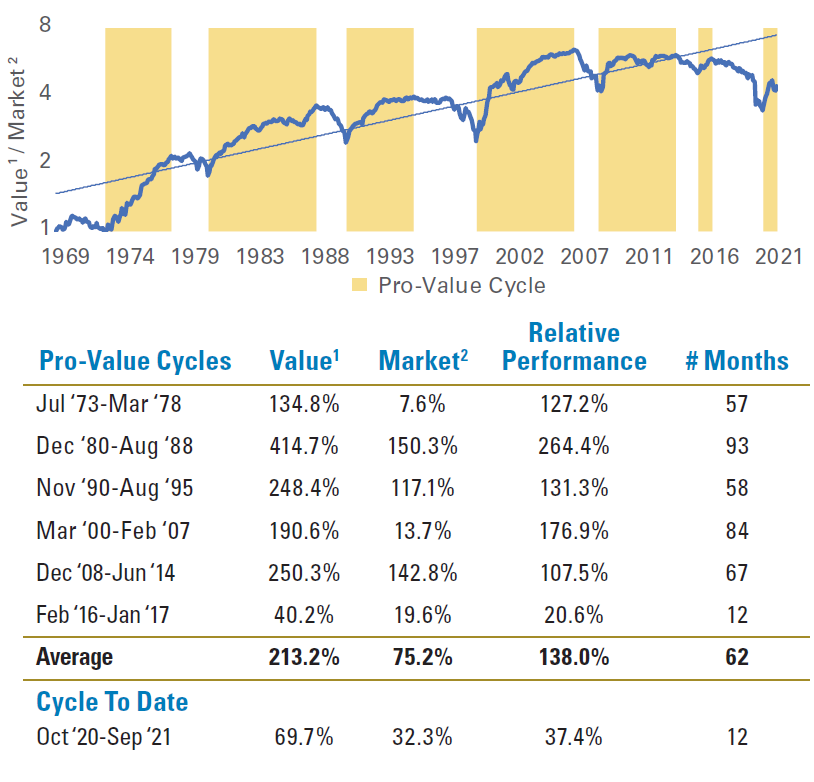
While value has outperformed the broader market by 320 basis points per year on average over the last 50+ years, it hasn’t happened in a straight line. In fact, even during powerful value cycles, there are numerous shorter periods in which value underperforms the market (Figure 3).
Figure 3 – History of Value *1 Outperformance Vs. The Market *2
Source: Sanford C. Bernstein & Co., Pzena analysis
Blue solid line within chart represents a relative index displayed using a logarithmic scale.
*1 Cheapest quintile price to book of the ~1,000 largest US stock universe (equal-weighted data). *2 Cap-weighted universe data. Returns do not represent any specific Pzena product or service. We define a cycle as when the relative performance of value vs. the market from the last peak or trough is at least +/-1500 basis points and has persisted for a minimum of 12 months. Data in US dollars through September 30, 2021. Past performance is not indicative of future returns.
Over the past 42 years, the Russell 1000 Value Index has outperformed the Russell 1000 Growth in 51% of all months. Interestingly, during pro-value cycles, or periods when value dominates growth, this only improves to 56% (Figure 4).
Figure 4 – Bumps in the Value Cycle
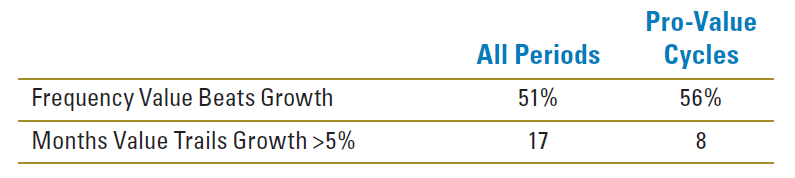
Source: FTSE Russell, Sanford C. Bernstein & Co., Pzena analysis Value = Russell 1000 Value Index. Growth = Russell 1000 Growth Index.
The pro-value cycle dates are derived from the previous figure. Data in US dollars from January 1, 1979 – September 30, 2021. Past performance is not indicative of future returns.
Even among the 17 most extreme months of value underperformance, eight of them occurred during pro-value cycles, and four of those happened during the first 20 months of the post-Tech Bubble period, which was one the greatest value cycles on record. That cycle lasted more than seven years. Investors who clung to growth stocks, failing to appreciate that the cycle had turned, on average missed out on more than 87 percentage points of value outperformance versus the market, or about half the value outperformance for the entire cycle.
STRONG OPERATING METRICS
Low multiples and long cycles are great, but at the end of the day an investor is buying shares of businesses, and ideally good businesses. One typical criticism of cheap stocks is the myth that they are low quality. When taken in aggregate, the profile of cheap stocks is quite different. The stocks currently in the cheapest quintile have generated an historical average return on equity (ROE) in the low- to mid-teens across US and non-US geographies. Additionally, these stocks have historically grown the top line at mid-single digits, proving a fruitful hunting ground for the active value investor (Figure 5).
Figure 5 – Operating Metrics of the Cheapest Quintile
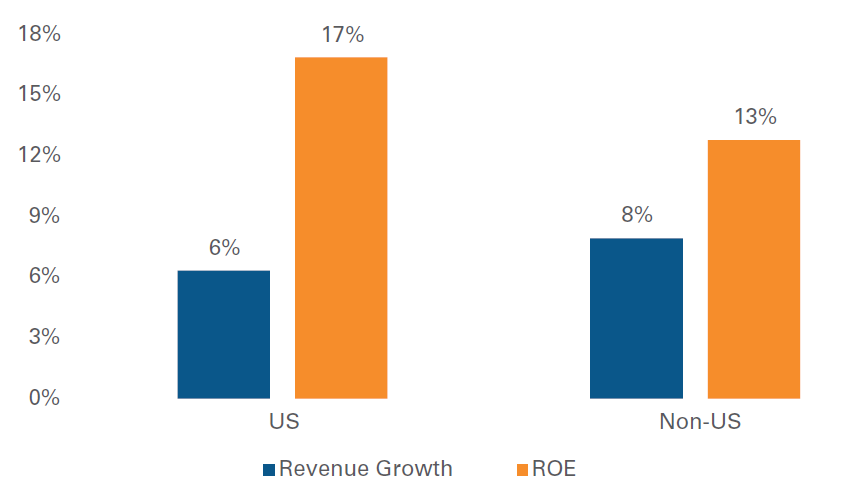
Source: FactSet, Reuters, Pzena analysis
US and Non-US Cheap Stocks is the cheapest 20% of stocks based on Pzena’s estimates of their price-to-normal valuations, measured on an equally weighted basis within their relative universes. Universes comprise the largest stocks by market capitalization for each region as follows: ~1,000 largest US; ~1,500 largest Non-US. Return on equity and revenue growth average calculated over trailing 10-year period. Data as of Sep 30, 2021. Does not represent any specific Pzena product or service.
POWERFUL EARNINGS GROWTH AT A SIGNIFICANT DISCOUNT
Value stocks were hit particularly hard, as the world went into lockdown in 2020. As stocks recover from COVID-19, Wall Street analysts are projecting earnings of value stocks to grow at more than a 20% compound annual growth rate (Figure 6). We believe supply chain disruptions and the Delta variant of COVID-19 will not negate an eventual full economic recovery, though could lead to a more protracted one, which should extend the associated outperformance of value stocks.
Figure 6 – 2020 – 2023E Earnings Growth (CAGR) is Faster Among Cheaper Stocks
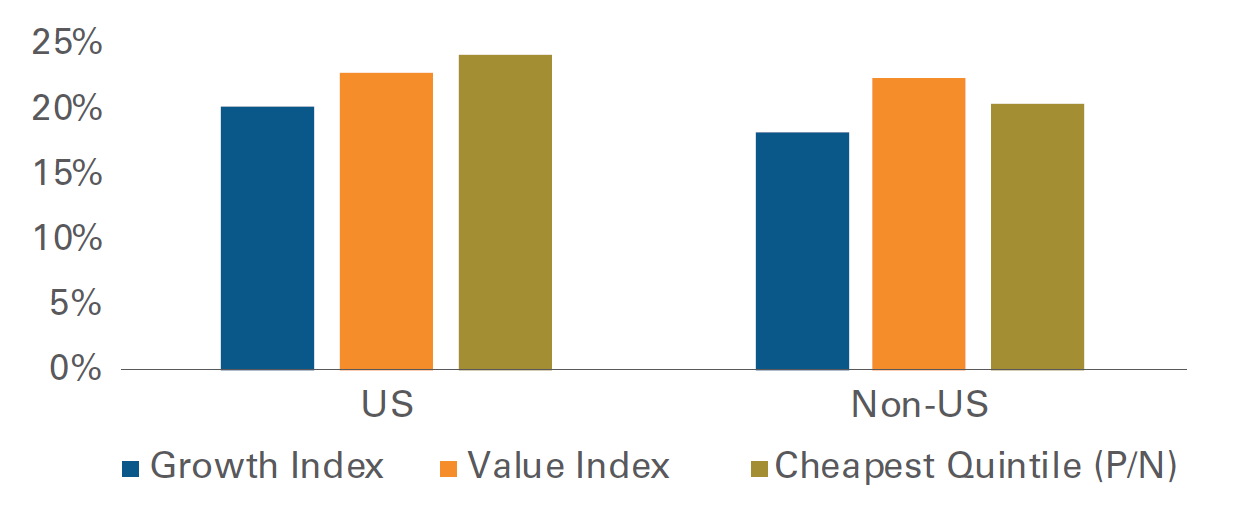
Source: FactSet, Pzena analysis
Full year 2023 earnings based on consensus estimates and pricing as of September 30, 2021.
US and Non-US Growth is the Russell 1000 Growth Index and MSCI ACWI ex USA Growth Index.
US and Non-US Value is the Russell 1000 Value Index and MSCI ACWI ex USA Value Index.
US and Non-US Cheapest Quintile is the cheapest 20% of stocks based on Pzena’s estimates of their price-to-normal valuations, measured on an equally weighted basis within their relative universes. Universes comprise the largest stocks by market capitalization for each region as follows: ~1,000 largest US; ~1,500 largest Non-US.
The cheapest stocks are projected to grow slightly faster than growth stocks the next few years, while trading at a roughly 60% discount (Figure 7).
Figure 7 – 2023E Multiples
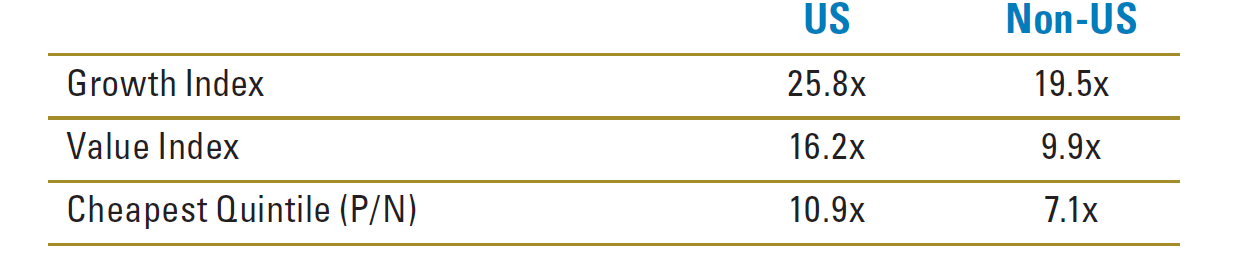
Source: FactSet, Pzena analysis
Full year 2023 earnings based on consensus estimates and pricing as of September 30, 2021.
US and Non-US Growth is the Russell 1000 Growth Index and MSCI ACWI ex USA Growth Index.
US and Non-US Value is the Russell 1000 Value Index and MSCI ACWI ex USA Value Index.
US and Non-US Cheapest Quintile is the cheapest 20% of stocks based on Pzena’s estimates of their price-to-normal valuations,
measured on an equally weighted basis within their relative universes. Universes comprise the largest stocks by market capitalization for each region as follows: ~1,000 largest US; ~1,500 largest Non-US.
CONCLUSION – MAINTAIN FOCUS
Pro-value cycles have never happened in a straight line, and the current cycle is no different. Supply chain disruptions and COVID-19 variants may impact the timing of the recovery, but value stocks should continue to see earnings recover at a more rapid pace than the rest of the market over the next couple of years, as the economic recovery continues to take hold. We believe the ability to purchase high quality companies at low-teens earnings yields is what enduring value cycles are made of.
FURTHER INFORMATION
These materials are intended solely for informational purposes. The views expressed reflect the current views of Pzena Investment Management (“PIM”) as of the date hereof and are subject to change. PIM is a registered investment adviser registered with the United States Securities and Exchange Commission. PIM does not undertake to advise you of any changes in the views expressed herein. There is no guarantee that any projection, forecast, or opinion in this material will be realized. Past performance is not indicative of future results. All investments involve risk, including risk of total loss.
This document does not constitute a current or past recommendation, an offer, or solicitation of an offer to purchase any securities or provide investment advisory services and should not be construed as such. The information contained herein is general in nature and does not constitute legal, tax, or investment advice. PIM does not make any warranty, express or implied, as to the information’s accuracy or completeness. Prospective investors are encouraged to consult their own professional advisers as to the implications of making an investment in any securities or investment advisory services.
London Stock Exchange Group plc and its group undertakings (collectively, the “LSE Group”). ©LSE Group 2020. FTSE Russell is a trading name of certain of the LSE Group companies. Russell® is a trade mark of the relevant LSE Group companies and is used by any other LSE Group company under license. All rights in the FTSE Russell indexes or data vest in the relevant LSE Group company which owns the index or the data. Neither LSE Group nor its licensors accept any liability for any errors or omissions in the indexes or data and no party may rely on any indexes or data contained in this communication. No further distribution of data from the LSE Group is permitted without the relevant LSE Group company’s express written consent. The LSE Group does not promote, sponsor or endorse the content of this communication.
The Russell 1000® Value Index measures the performance of the large-cap value segment of the US equity universe. It includes those Russell 1000® companies with lower price-to-book ratios and lower expected growth values. The Russell 1000® Growth Index measures the performance of the large-cap growth segment of the US equity universe. It includes those Russell 1000® companies with higher price-to-book ratios and higher forecasted growth values. The indices cannot be invested in directly.
The MSCI information may only be used for internal use, may not be reproduced or redisseminated in any form and may not be used as a basis for or a component of any financial instruments or products or indices. None of the MSCI information is intended to constitute investment advice or a recommendation to make (or refrain from making) any kind of investment decision and may not be relied on as such. Historical data and analysis should not be taken as an indication or guarantee of any future performance analysis, forecast or prediction. The MSCI information is provided on an “as is” basis and the user of this information assumes the entire risk of any use made of this information. MSCI, each of its affiliates and each other person involved in or related to compiling, computing or creating any MSCI information (collectively, the MSCI Parties) expressly disclaims all warranties (including, without limitation, any warranties of originality, accuracy, completeness, timeliness, non-infringement, merchantability and fitness for a particular purpose) with respect to this information. Without limiting any of the foregoing, in no event shall any MSCI party have any liability for any direct, indirect, special, incidental, punitive, consequential (including, without limitation, lost profits) or any other damages.
The MSCI ACWI ex USA Value Index is a free float-adjusted market capitalization index that is designed to measure developed and emerging market equity performance, excluding the U.S., capturing large and mid-cap securities exhibiting overall value style characteristics. The MSCI ACWI ex USA Growth Index is a free float-adjusted market capitalization index that is designed to measure developed and emerging market equity performance, excluding the U.S., capturing large and mid-cap securities exhibiting overall growth style characteristics. The indices cannot be invested in directly.
For U.K. Investors Only:
This financial promotion is issued by Pzena Investment Management, Ltd. (“PIM UK”). PIM UK is a limited company registered in England and Wales with registered number 09380422, and its registered office is at 34-37 Liverpool Street, London EC2M 7PP, United Kingdom. PIM UK is an appointed representative of Mirabella Advisers LLP, which is authorised and regulated by the Financial Conduct Authority. The Pzena documents are only made available to professional clients and eligible counterparties as defined by the FCA. Past performance is not indicative of future results. The value of your investment may go down as well as up, and you may not receive upon redemption the full amount of your original investment. The views and statements contained herein are those of Pzena Investment Management and are based on internal research.
For Australia and New Zealand Investors Only:
This document has been prepared and issued by Pzena Investment Management, LLC (ARBN 108 743 415), a limited liability company (“Pzena”). Pzena is regulated by the Securities and Exchange Commission (SEC) under U.S. laws, which differ from Australian laws. Pzena is exempt from the requirement to hold an Australian financial services license in Australia in accordance with ASIC Corporations (Repeal and Transitional) Instrument 2016/396. Pzena offers financial services in Australia to ‘wholesale clients’ only pursuant to that exemption. This document is not intended to be distributed or passed on, directly or indirectly, to any other class of persons in Australia.
In New Zealand, any offer is limited to ‘wholesale investors’ within the meaning of clause 3(2) of Schedule 1 of the Financial Markets Conduct Act 2013 (‘FMCA’). This document is not to be treated as an offer, and is not capable of acceptance by, any person in New Zealand who is not a Wholesale Investor.
For Jersey Investors Only:
Consent under the Control of Borrowing (Jersey) Order 1958 (the “COBO” Order) has not been obtained for the circulation of this document. Accordingly, the offer that is the subject of this document may only be made in Jersey where the offer is valid in the United Kingdom or Guernsey and is circulated in Jersey only to persons similar to those to whom, and in a manner similar to that in which, it is for the time being circulated in the United Kingdom, or Guernsey, as the case may be. The directors may, but are not obliged to, apply for such consent in the future. The services and/or products discussed herein are only suitable for sophisticated investors who understand the risks involved. Neither Pzena Investment Management, Ltd. nor Pzena Investment Management, LLC nor the activities of any functionary with regard to either Pzena Investment Management, Ltd. or Pzena Investment Management, LLC are subject to the provisions of the Financial Services (Jersey) Law 1998.
For South African Investors Only:
Pzena Investment Management, LLC is an authorised financial services provider licensed by the South African Financial Sector Conduct Authority (licence nr: 49029).
© Pzena Investment Management, LLC, 2021. All rights reserved.