
Global Banks: Resilience in the Face of Crisis
This Pzena Investment Management, LLC (“Pzena”) thought piece is a historical document and is intended solely for informational purposes. The views expressed reflect the views of Pzena Investment Management (“PIM”) as of the date published and are subject to change. Neither the writer nor PIM undertake to advise you of any changes in the views expressed therein. There is no guarantee that any projection, forecast, or opinion in this material has been or will be realized. Past performance is not indicative of future results. All investments involve risk, including risk of total loss.
(June 2020)
We view the potential for a systemic bank failure due to the COVID-19 economic shock as low. Today’s banks are more resilient than in the past given their robust capital positions and lower risk profile, not to mention supportive liquidity operations provided by central banks.
Banks Stand Out
While their valuations suggest the need for industry-wide dilutive capital raises, banks are broadly in good shape relative to other segments of the economy and their history.
Banks’ Strength
Equity capital is at post-World War II highs. Combined with de-risked and deleveraged balance sheets over the last decade, this implies that widespread bank insolvencies are less likely than in the past.
Bank stocks have come under intense pressure as investors contemplate the potential for meaningful credit losses on their balance sheets.
Markets tend to fixate on recent history, and we argue that there are many reasons to believe this period will resemble a “typical” recessionary environment — not the financial crisis of 2008. Strong capital positions and supportive government actions bolstering liquidity have reduced the risk of systemic bank failures related to this COVID-19-induced shock. After examining how banks have fared in prior periods of economic decline, we believe that this time will not resemble the pattern of the global financial crisis (GFC).
To examine what lessons we can draw, we surveyed global developed-market credit cycles going back to the Great Depression. This historical survey supports our view that in aggregate, the banking system today can sustain a once-in-a-century level of loan losses without the risk of meaningful dilution to equity owners. Importantly, however, this doesn’t preclude individual banks from having credit issues requiring more capital.
Before digging into the data, it’s useful to review some fundamental mechanics about how banks work, such as how credit events impact a bank’s earnings and its balance sheet. In its simplest form, a bank gathers deposits and advances the money out to borrowers in the form of loans. The spread between the lending rate and the rate paid to depositors provides an earnings buffer to absorb any losses that may occur from a borrower’s failure to repay. Banks are required to set up a reserve for loan losses and to maintain equity capital in case those losses exceed current earnings. Each reporting period, banks estimate future loan losses and adjust the size of the reserve accordingly. The adjustment, or “provision for loan losses,” is accounted for in the profit and loss statement (P&L) and the “reserve” resides on the balance sheet. Any profits earned by a bank are either added to its capital and used to fund growth or returned to shareholders through dividends or buybacks or both.
CREDIT EVENTS RARELY LEAD TO CAPITAL DESTRUCTION FOR BANKS
The process of monitoring loans and adjusting reserves happens throughout all credit environments. Most of the time, delinquencies are more than offset by a bank’s overall earnings and are manageable without the bank having to raise additional capital.
In more extreme credit events, a significant increase in expected loan losses causes a bank’s capital levels to fall below the regulatory minimums. Though the exact calculations and standards vary by region, regulators around the world require banks to maintain a certain amount of capital relative to their assets. Breaching these minimums due to losses from poor credit can ultimately result in shareholder dilution, via a forced capital raise at a distressed price, or an outright nationalization of the bank.
In looking at nearly 130 years of banking history, we see that credit events resulting in significant capital destruction have been less frequent than intuition suggests. Only a few recessions globally have resulted in large bank losses: The Great Depression, the savings and loan (S&L) crisis, the bursting of Japan’s real estate and stock market bubble, the Asian financial crisis, and the GFC. The good news is that bank equity capital is at post-World War II highs and, relative to assets, is approximately 40% greater than in 2007. These additional equity buffers combined with de-risked balance sheets over the last decade imply that widespread bank insolvencies are less likely than in the past.
Current valuations imply that banks will book loan losses in orders of magnitude unlike any recorded in US history and, further, that announced government interventions will be broadly ineffective. There is no reward without some level of risk, but we believe the tradeoff today is asymmetrical and skewed to the upside.
BANKS HAVE RARELY ENDURED LARGE LOSSES
Figure 1 demonstrates clearly that large credit events in the US have been the exception rather than the rule. Even the extreme calamities that include two world wars and the Spanish Flu of 1918 didn’t lead to large-scale losses for banks. We will broaden the scope of our analysis outside of the United States shortly but start here because it provides the most extended history of data on the subject.
Figure 1: Banks Have Rarely Provisioned for More than 2% of Loans
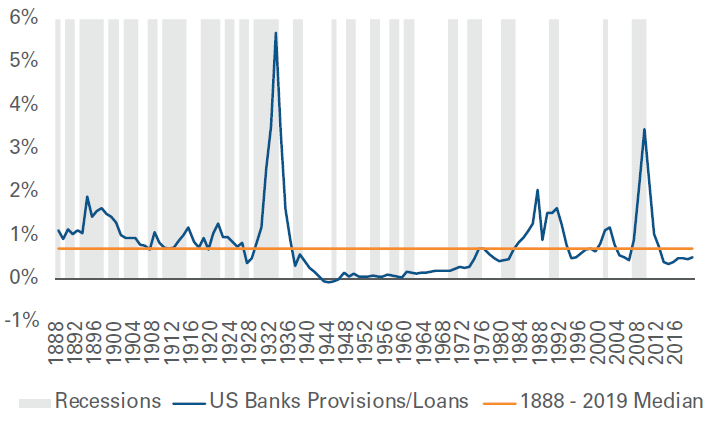
Source: FDIC, SNL, Autonomous, Pzena analysis
TODAY’S LOAN LOSSES ARE NOT A THREAT TO SOLVENCY
One way to quantify bank solvency is to determine how much loan losses could grow before breaching minimum capital requirements. At the end of 2019, banks had reserves equal to approximately 1.2% of loans. In addition, their annual earnings before the provision for loan losses has been about 3.4% of loan balances. (This is the five-year average of the entire US banking sector.)1 Thus, if the loan losses had to be absorbed over 3 years, banks could forfeit 10.1% of their beginning loan balances before eating into capital. US banks ended 2019 with 7.8% in excess capital relative to loan balances. So, adding the 1.2% in existing reserves, the 10.1% in cumulative earnings over three years, and the 7.8% in excess capital, banks can absorb total loan losses of up to 19.1% before breaching minimum capital requirements. Put simply, capital cushions are far more robust than they were during the GFC, leaving banks better equipped to absorb losses than they were in the past.
Moving on to banks in the eurozone, we see from Figure 2 that they can absorb 9.4% in loan losses. The combination of lower excess capital and lower profitability via earnings illustrates decreased flexibility among eurozone banks relative to the US.
Figure 2: Banks Annually Could Absorb All Depression-Era Write-Downs
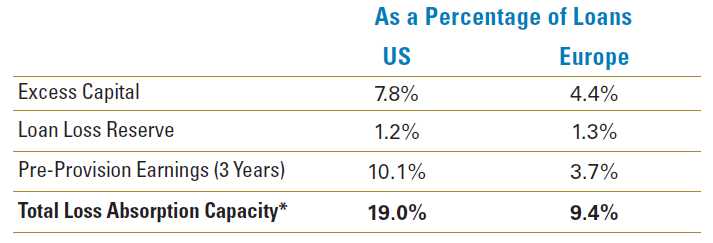
Figures may not sum due to rounding.
*A higher proportion of low-risk loans, such as high-quality mortgages on European balance sheets, drives some of the gap in loan loss absorption capacity.
Source: Pzena analysis, FDIC, ECB.
In summary, banks have a substantially greater capacity for absorption that should shield them from more extreme loss rates incurred in past credit crises.2 Like everything, the devil is in the details. Despite the overall healthy nature of the industry, individual banks are bound to book outsized credit losses and be forced to raise capital. The opportunity for investors today lies in picking among the solid franchises and taking advantage of the fear surrounding this industry because we believe the aggregate picture is bright.
A RUN-UP NORMALLY CAUSES LARGE BANK LOSSES IN CREDIT
To get a better sense of what bad credit events look like and how today’s loss-absorption capacity of 19.1% compares, we examined 10 periods of extreme banking system stress around the world, including the US Great Depression (starting in 1929), the US S&L Crisis (1987), Japan’s Bubble (1989), the Scandinavian Crisis (1991), several EM Debt Crises (1994/1997/1998/2001), the GFC (2008), and the Peripheral European Crisis (2008–2012). Each of these events were preceded by a meaningful increase in private debt-to-GDP, a characteristic that doesn’t exist today.
Periods of excessive debt-to-GDP growth naturally coincide with booms in fixed asset investment (FAI). The progression of rising debt-to-GDP, inflating asset prices, and increasing leverage causes an asset bubble that ultimately hits a breaking point. Then the bubble bursts. The collateral for the excess debt becomes impaired and leads to a credit cycle. Japan’s property bubble during the 1980s serves as an example. High savings and negative interest rates caused over-investment in real estate, pushing asset prices ever higher. Similarly, the Baltic region in the early 2000s experienced an unprecedented pace of growth in foreign direct investment driving up asset prices and ending in a banking crisis. Figure 3 illustrates that the peaks in debt-to-GDP growth often coincide with the onset of financial crises.
Figure 3: A Run-Up in Debt-to-GDP Portends Trouble
10-YEAR INCREASE
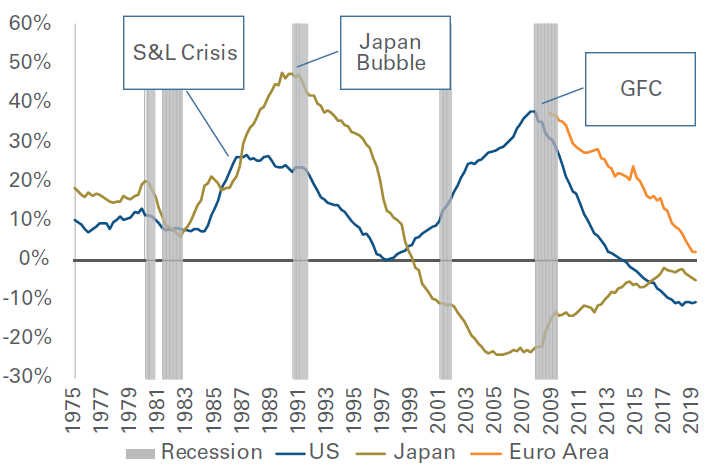
Source: Federal Reserve Bank of St. Louis.
But this pandemic-inspired recession is quite different. The post-GFC recovery didn’t include a run-up in FAI. There has been no run-up in private debt-to-GDP. Nor has there been a comparable bubble in real asset prices. This downturn is a consumption-driven recession caused by public health issues. It’s undeniable that some segments have re-leveraged (e.g., private equity-sponsored, below-investment-grade corporate issuers, etc.). However, this type of debt is held mostly outside of the banks due to both regulatory constraints and because banks’ business models have substantially reduced risk since the GFC. Furthermore, the private sector had been deleveraging going into this downturn. This is especially true of consumers, who accounted for some of the worst credit performance during the GFC.
Other crises were exacerbated by regulatory problems that led to liquidity issues and the subsequent deleveraging among banks. For example, failures during the Great Depression were caused largely by a deposit-driven bank run, leading to a liquidity event. In the current crisis, regulators and governments have been proactive in supporting banks from both a liquidity and capital perspective. For instance, the US Federal Reserve bought more assets in the first two months of this downturn than in the first five years of the GFC. Regardless of one’s politics, it’s difficult to deny that the magnitude of today’s interventions to buttress the economy is unprecedented. The point is not to minimize the economic shock from COVID-19 but to contextualize it in terms of capital and liquidity and how these safeguards seem disconnected from current valuations.
During the Great Depression, over 5,0003 banks failed — more failures than over the next 90 years combined. In this case, it wasn’t loan losses that posed the problem, but liquidity. A run on the banks drained deposits, as panicked customers demanded cash. With 30% of deposits withdrawn, the banks quickly tightened credit, contracting their loans outstanding by 47%4. This event prompted the creation of the Federal Deposit Insurance Corporation to ensure that depositors’ funds were protected in the event of a bank failure, another bank run, or any corresponding forced deleveraging.
Turning to the GFC, excessive lending in the US housing market created a bubble in home prices. Many loans were made to borrowers who were incapable of servicing their debt, and the subsequent defaults led to sizable losses for lenders. Once again, liquidity issues exacerbated the losses, this time in wholesale funding and shadow banking (non-bank lenders), sparking solvency concerns for banking systems first in the US and then around the world. To meet short-term liabilities, numerous banks offered their illiquid assets at fire-sale prices, pushing loan losses arguably higher than they should have been.
So, what kind of systemic credit losses are possible from any single crisis? Figure 4 shows that based on history losses have ranged between 2% and 12% and have typically been absorbed over several years. The bursting of the Japan asset bubble was an exception; here, the 12% loan losses took more than a decade to materialize.
Figure 4: In Aggregate, The Banking System Absorbs Fewer Losses
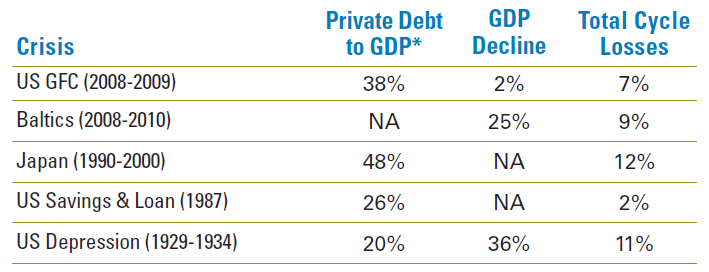
*Reflects the change preceding the crisis. For the GFC, Japan, and S&L crises the data reflect a 10-year change; for the Depression, 5 years.
Source: Pzena analysis, FDIC, Federal Reserve, World Bank, KBW, Eesti Pank, Latvijas Banka, and Crisis and Change in the Japanese Financial System-Takeo Hoshi.
Recall that banks have the capacity today to manage sizable losses in the US (up to 19.2%) and the eurozone (up to 9.4%). Given the historical range of a cumulative 2%-12% in total losses for banking systems, banks are well-positioned to deal with a substantial crisis today.
GOVERNMENTS AND REGULATORS: FRIENDS OR FOES?
Like any regulated industry, banks are at the mercy of political forces, in their case a combination of government agencies and central banks. Actions taken by those entities have far-reaching consequences for the industry. The policy response during the Great Depression was liquidation, an approach that’s now viewed as more damaging than supportive of the broader economy. The regulatory reaction during the S&L crisis of the 1980s was characterized by lenience and forbearance, which led to moral hazard and an expensive taxpayer bailout.
In the current recession, regulators have considered banks to be part of the solution. Governments need banks to work swiftly and around the clock to properly distribute money to the intended beneficiaries of public support (e.g., Payroll Protection and Main Street Lending Programs). Regulators are encouraging them to work with borrowers and are already working to help banks defer customer loans without increasing risk-weighted capital charges. While the winds of politics can shift, so far, banks are viewed as constructive partners to the government in bolstering a sensitive economy.
Figure 5: Central Banks’ Unprecedented Balance Sheet Expansion
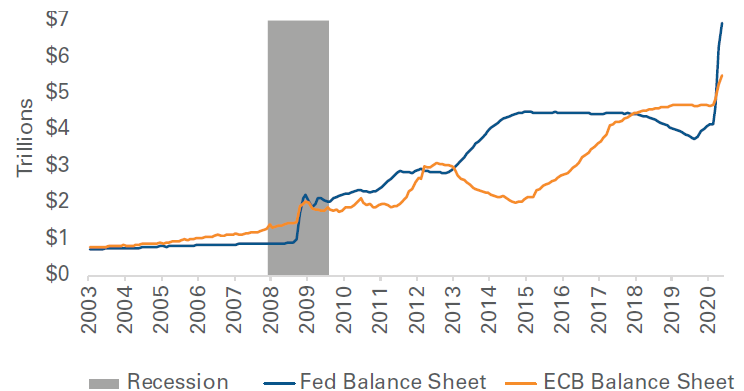
Source: Federal Reserve Bank of St. Louis, ECB.
The magnitude of the actions taken by central banks so far is astounding (figure 5): As mentioned earlier, the US Fed expanded its balance sheet with unprecedented speed in the early days of COVID-19 lockdowns, growing its balance sheet by over 50%. Developed economies around the globe have taken similar actions to those moves by the Fed. In March, the European Central Bank announced a series of asset purchase programs, including a €750 billion Pandemic Emergency Purchase Program, to inject liquidity into both public and private sector capital markets. As with their US counterparts, European regulators have taken a constructive stance toward banks both by permitting them to consume countercyclical capital buffers and delaying the implementation of new Basel IV capital rules. In return, they expect banks will remain supportive to borrowers. Japan and the UK have deployed similar playbooks. In all cases, monetary policy and regulatory easing have been complemented by a massive fiscal stimulus to protect consumers and corporate balance sheets — measures which we expect to partially mitigate the extent of loan losses.
Bottom Line: Today’s economic environment is like no other that we have seen in modern history, and against this volatile backdrop, bank stocks stand out. While their valuations suggest the need for industry-wide dilutive capital raises, banks are broadly in good shape relative to other segments of the economy and their history. After being widely maligned and held accountable for the global financial crisis, this time, banks get to be part of the solution. In much of the developed world, they are working in concert with their local governments to bolster the public by creating liquidity for a wide range of businesses, large and small. Furthermore, many of these banking franchises are leaner, more resilient, and have balance sheets that are fortified to withstand a protracted downturn. In our opinion, the banking system has more-than-adequate capital to remain solvent under the current circumstances. For our part, the ability to focus on bottom-up, bank-by-bank analyses within a healthy global bank ecosystem confirms our belief that banking is one of the most compelling areas for investment that we have seen.
1 Normally investors consider pre-tax, pre-provision return on assets. This has averaged 1.8%. Since loans are 55% of assets, that translates into 3.4% of loan balances. Source: FDIC.
2 We acknowledge several simplifying assumptions in our analysis. First, stress-case scenarios generally inflate risk-weighted assets (RWA) as borrowers tap undrawn facilities, and worsening credit conditions drive higher risk weightings. (For perspective, if RWA inflation is 10%, the above factors would reduce banks’ total loss absorption capacity by over 1%.) Second, a bank’s pre-provision earnings profile in a stress scenario depends on such factors as the level of interest rates and transaction activity as well as the business mix. Lastly, the overall analysis belies significant variation across geographies or individual companies, particularly in Europe. Consider, for example, that the 5-year average pre-tax return on assets for banks starts as a losing proposition at -114 basis points — in Greece — and ranges up to a positive 170 basis points — in Estonia (source: ECB).
3 Source: FDIC, KBW research.
4 Source: St. Louis Fed. https://fraser.stlouisfed.org/files/docs/publications/bms/1914-1941/BMS14-41_complete.pdf
DISCLOSURES
These materials are intended solely for informational purposes. The views expressed reflect the current views of Pzena Investment Management, LLC (“PIM”) as of the date hereof and are subject to change. PIM does not undertake to advise you of any changes in the views expressed herein. Past performance is not indicative of future results. All investments involve risk, including risk of total loss.
The specific portfolio securities discussed in this material are included for illustrative purposes only and were selected based on their ability to help you better un-derstand our investment process. They do not represent all of the securities purchased or sold by PIM during the period. There is no assurance that any securities discussed herein remain in our portfolios at the time you receive this presentation or that securities sold have not been repurchased. PIM is a discretionary investment manager and does not make “recommendations” to buy or sell any securities.
This document does not constitute a current or past recommendation, an offer, or solicitation of an offer to purchase any securities or provide investment advisory services and should not be construed as such. The information contained herein is general in nature and does not constitute legal, tax, or investment advice. PIM does not make any warranty, express or implied, as to the information’s accuracy or completeness. Prospective investors are encouraged to consult their own pro-fessional advisers as to the implications of making an investment in any securities or investment advisory services.
For European Investors Only:
This financial promotion is issued by Pzena Investment Management, Ltd. Pzena Investment Management, Ltd. is a limited company registered in England and Wales with registered number 09380422, and its registered office is at 34-37 Liverpool Street, London EC2M 7PP, United Kingdom. Pzena Investment Management, Ltd is an appointed representative of DMS Capital Solutions (UK) Limited and Mirabella Advisers LLP, which are authorised and regulated by the Financial Conduct Authority. The Pzena documents are only made available to professional clients and eligible counterparties as defined by the FCA. The value of your investment may go down as well as up, and you may not receive upon redemption the full amount of your original investment. The views and statements contained herein are those of Pzena Investment Management, LLC and are based on internal research.
For Australia and New Zealand Investors Only:
This document has been prepared and issued by Pzena Investment Management, LLC (ARBN 108 743 415), a limited liability company (“PIM”). PIM is regulated by the Securities and Exchange Commission (SEC) under U.S. laws, which differ from Australian laws. PIM is exempt from the requirement to hold an Australian financial services license in Australia in accordance with ASIC Corporations (Repeal and Transitional) Instrument 2016/396. PIM offers financial services in Australia to ‘wholesale clients’ only pursuant to that exemption. This document is not intended to be distributed or passed on, directly or indirectly, to any other class of persons in Australia. In New Zealand, any offer is limited to ‘wholesale investors’ within the meaning of clause 3(2) of Schedule 1 of the Financial Markets Conduct Act 2013 (‘FMCA’). This document is not to be treated as an offer, and is not capable of acceptance by, any person in New Zealand who is not a Wholesale Investor.
For Jersey Investors Only:
Consent under the Control of Borrowing (Jersey) Order 1958 (the “COBO” Order) has not been obtained for the circulation of this document. Accordingly, the offer that is the subject of this document may only be made in Jersey where the offer is valid in the United Kingdom or Guernsey and is circulated in Jersey only to persons similar to those to whom, and in a manner similar to that in which, it is for the time being circulated in the United Kingdom, or Guernsey, as the case may be. The directors may, but are not obliged to, apply for such consent in the future. The services and/or products discussed herein are only suitable for sophisticated investors who understand the risks involved. Neither Pzena Investment Management, Ltd. nor Pzena Investment Management, LLC nor the activities of any functionary with regard to either Pzena Investment Management, Ltd. or Pzena Investment Management, LLC are subject to the provisions of the Financial Services (Jersey) Law 1998.
For South Africa Investors Only:
Pzena Investment Management LLC is an authorised financial services provider licensed by the South African Financial Sector Conduct Authority (licence nr: 49029).